Examples
These examples can be exactly reproduced in GNU Octave 6.4.0 by using the seed specified at the beginning of each code block.
Examples in 2D
These examples were plotted with the plot_examples_2d() helper function available
here.
Manipulating the direction of cluster-supporting lines
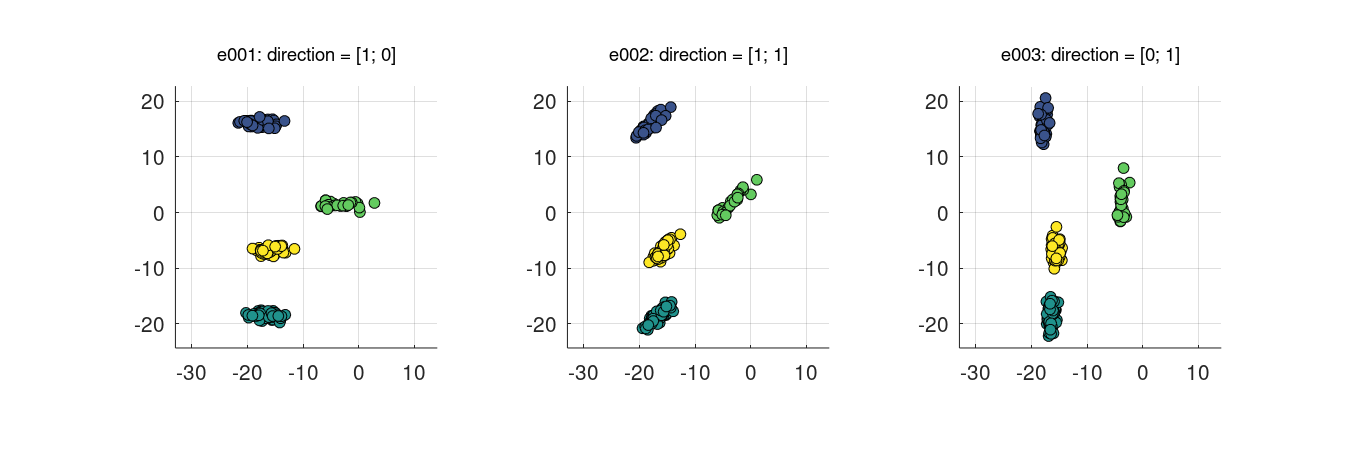
Using the direction parameter
seed = 123;

e001 = clugen(2, 4, 200, [1 0], 0, [10 10], 10, 1.5, 0.5, 'seed', seed);
e002 = clugen(2, 4, 200, [1 1], 0, [10 10], 10, 1.5, 0.5, 'seed', seed);
e003 = clugen(2, 4, 200, [0 1], 0, [10 10], 10, 1.5, 0.5, 'seed', seed);
plot_examples_2d(...
    e001, 'e001: direction = [1; 0]', ...
    e002, 'e002: direction = [1; 1]', ...
    e003, 'e003: direction = [0; 1]');
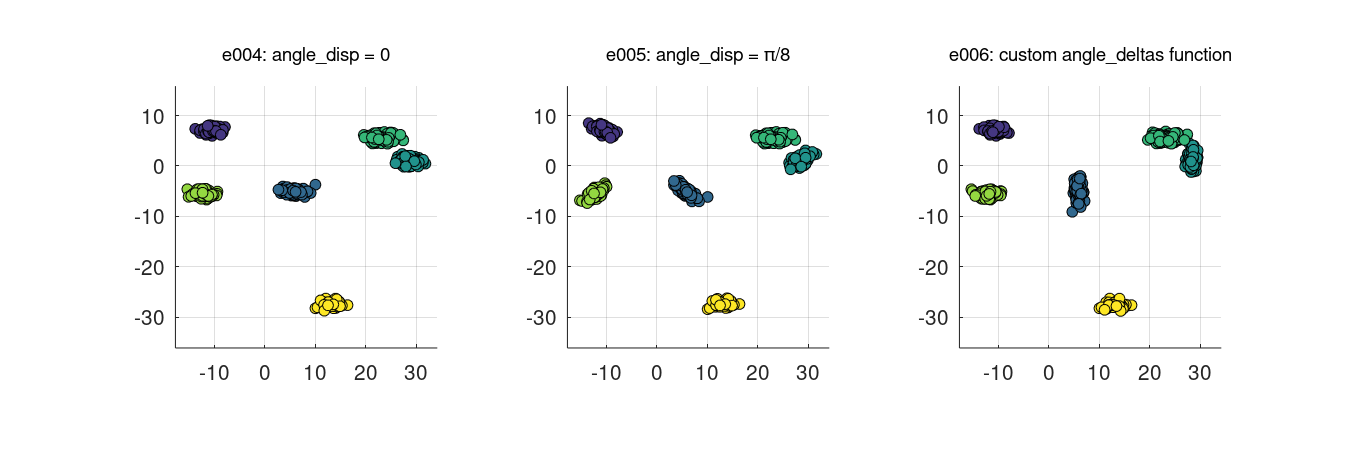
Changing the angle_disp parameter and using a custom angle_deltas_fn function
seed = 9876;

% Custom angle_deltas function: arbitrarily rotate some clusters by 90 degrees
% Requires the statistics toolbox in either Octave or MATLAB
angdel_90 = @(nclu, astd) randsample([0 pi/2], nclu, true);

e004 = clugen(2, 6, 500, [1 0], 0, [10 10], 10, 1.5, 0.5, 'seed', seed);
e005 = clugen(2, 6, 500, [1 0], pi / 8, [10 10], 10, 1.5, 0.5, 'seed', seed);
e006 = clugen(2, 6, 500, [1 0], 0, [10 10], 10, 1.5, 0.5, 'seed', seed, ...
    'angle_deltas_fn', angdel_90);
plot_examples_2d(...
    e004, 'e004: angle\_disp = 0', ...
    e005, 'e005: angle\_disp = π/8', ...
    e006, 'e006: custom angle\_deltas function');
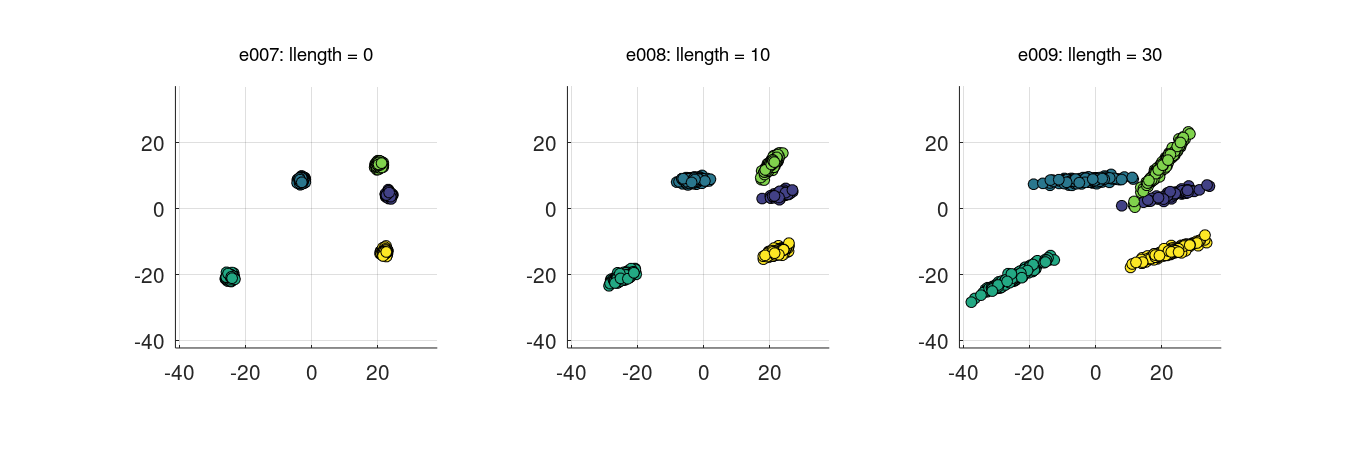
Manipulating the length of cluster-supporting lines
Using the llength parameter
seed = 1234;

e007 = clugen(2, 5, 800, [1 0], pi / 10, [10 10], 0, 0, 0.5, 'seed', seed, ...
    'point_dist_fn', 'n');
e008 = clugen(2, 5, 800, [1 0], pi / 10, [10 10], 10, 0, 0.5, 'seed', seed, ...
    'point_dist_fn', 'n');
e009 = clugen(2, 5, 800, [1 0], pi / 10, [10 10], 30, 0, 0.5, 'seed', seed, ...
    'point_dist_fn', 'n');
plot_examples_2d(...
    e007, 'e007: llength = 0', e008, 'e008: llength = 10', e009, 'e009: llength = 30');
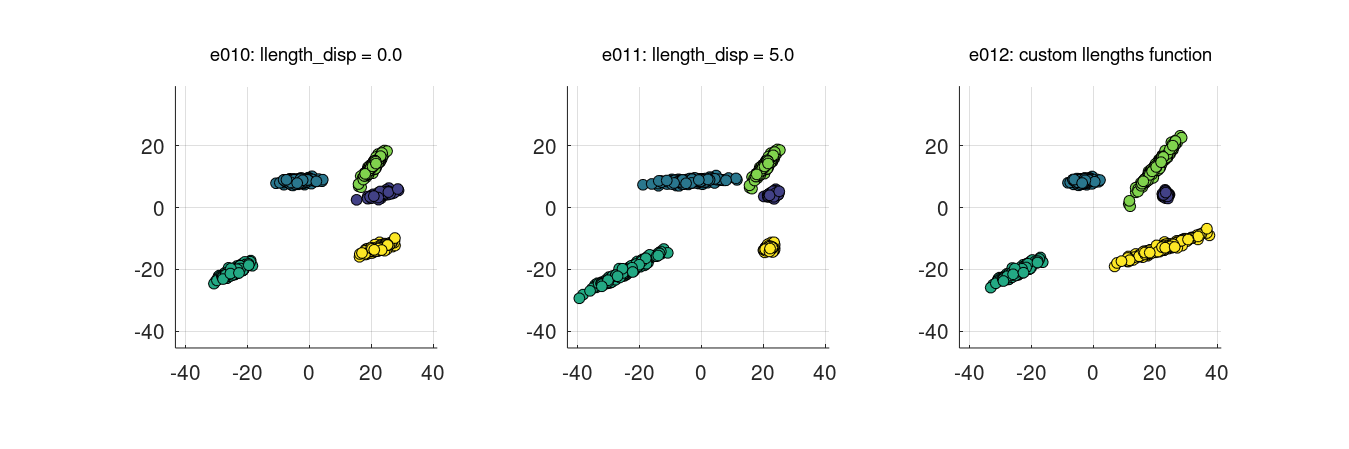
Changing the llength_disp parameter and using a custom llengths_fn function
seed = 1234;

% Custom llengths function: line lengths grow for each new cluster
llen_grow = @(nclu, llen, llenstd) llen * (0:(nclu - 1))' + llenstd * randn(nclu, 1);

e010 = clugen(2, 5, 800, [1 0], pi / 10, [10 10], 15,  0.0, 0.5, 'seed', seed, ...
    'point_dist_fn', 'n');
e011 = clugen(2, 5, 800, [1 0], pi / 10, [10 10], 15, 10.0, 0.5, 'seed', seed, ...
    'point_dist_fn', 'n');
e012 = clugen(2, 5, 800, [1 0], pi / 10, [10 10], 10,  0.1, 0.5, 'seed', seed, ...
    'point_dist_fn', 'n', 'llengths_fn', llen_grow);
plot_examples_2d(...
    e010, 'e010: llength\_disp = 0.0', ...
    e011, 'e011: llength\_disp = 5.0', ...
    e012, 'e012: custom llengths function');
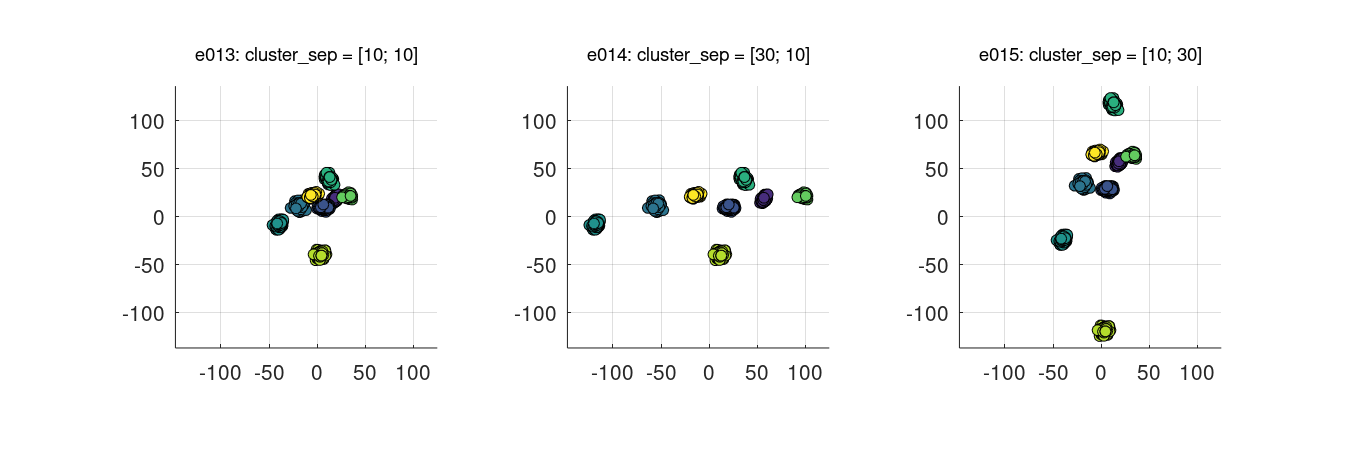
Manipulating relative cluster positions
Using the cluster_sep parameter
seed = 3210;

e013 = clugen(2, 8, 1000, [1 1], pi / 4, [10 10], 10, 2, 2.5, 'seed', seed);
e014 = clugen(2, 8, 1000, [1 1], pi / 4, [30 10], 10, 2, 2.5, 'seed', seed);
e015 = clugen(2, 8, 1000, [1 1], pi / 4, [10 30], 10, 2, 2.5, 'seed', seed);
plot_examples_2d(...
    e013, 'e013: cluster\_sep = [10; 10]', ...
    e014, 'e014: cluster\_sep = [30; 10]', ...
    e015, 'e015: cluster\_sep = [10; 30]');
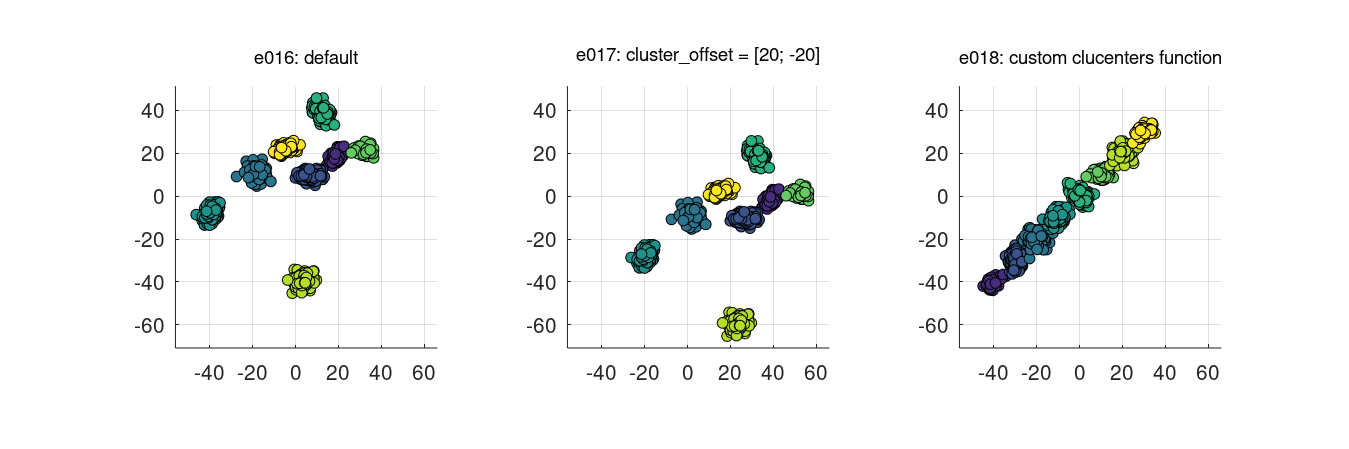
Changing the cluster_offset parameter and using a custom clucenters_fn function
seed = 3210;

% Custom clucenters function: places clusters in a diagonal
centers_diag = @(nclu, csep, coff) ones(nclu, numel(csep)) .* (1:nclu)' * max(csep) + coff';

e016 = clugen(2, 8, 1000, [1 1], pi / 4, [10 10], 10, 2, 2.5, 'seed', seed);
e017 = clugen(2, 8, 1000, [1 1], pi / 4, [10 10], 10, 2, 2.5, 'seed', seed, ...
    'cluster_offset', [20 -20]);
e018 = clugen(2, 8, 1000, [1; 1], pi / 4, [10 10], 10, 2, 2.5, 'seed', seed, ...
    'cluster_offset', [-50 -50], 'clucenters_fn', centers_diag);
plot_examples_2d(...
    e016, 'e016: default', ...
    e017, 'e017: cluster\_offset = [20; -20]', ...
    e018, 'e018: custom clucenters function');
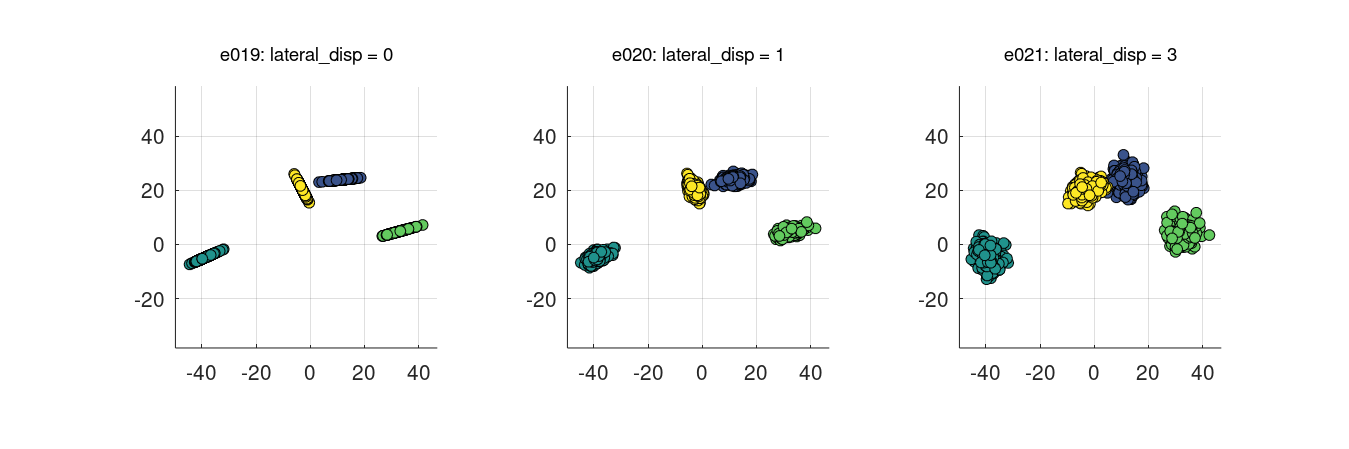
Lateral dispersion and placement of point projections on the line
Normal projection placement (default): proj_dist_fn = 'norm'
seed = 5678;

e019 = clugen(2, 4, 1000, [1 0], pi / 2, [20 20], 13, 2, 0.0, 'seed', seed);
e020 = clugen(2, 4, 1000, [1 0], pi / 2, [20 20], 13, 2, 1.0, 'seed', seed);
e021 = clugen(2, 4, 1000, [1 0], pi / 2, [20 20], 13, 2, 3.0, 'seed', seed);
plot_examples_2d(...
    e019, 'e019: lateral\_disp = 0', ...
    e020, 'e020: lateral\_disp = 1', ...
    e021, 'e021: lateral\_disp = 3');
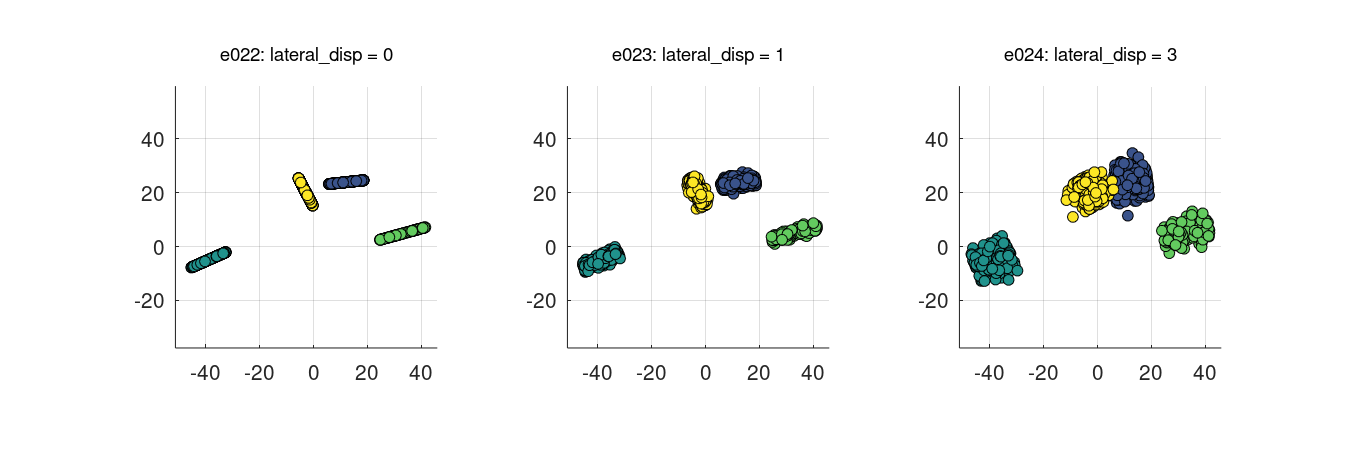
Uniform projection placement: proj_dist_fn = 'unif'
seed = 5678;

e022 = clugen(2, 4, 1000, [1 0], pi / 2, [20 20], 13, 2, 0.0, 'seed', seed, 'proj_dist_fn', 'unif');
e023 = clugen(2, 4, 1000, [1 0], pi / 2, [20 20], 13, 2, 1.0, 'seed', seed, 'proj_dist_fn', 'unif');
e024 = clugen(2, 4, 1000, [1 0], pi / 2, [20 20], 13, 2, 3.0, 'seed', seed, 'proj_dist_fn', 'unif');
plot_examples_2d(...
    e022, 'e022: lateral\_disp = 0', ...
    e023, 'e023: lateral\_disp = 1', ...
    e024, 'e024: lateral\_disp = 3');
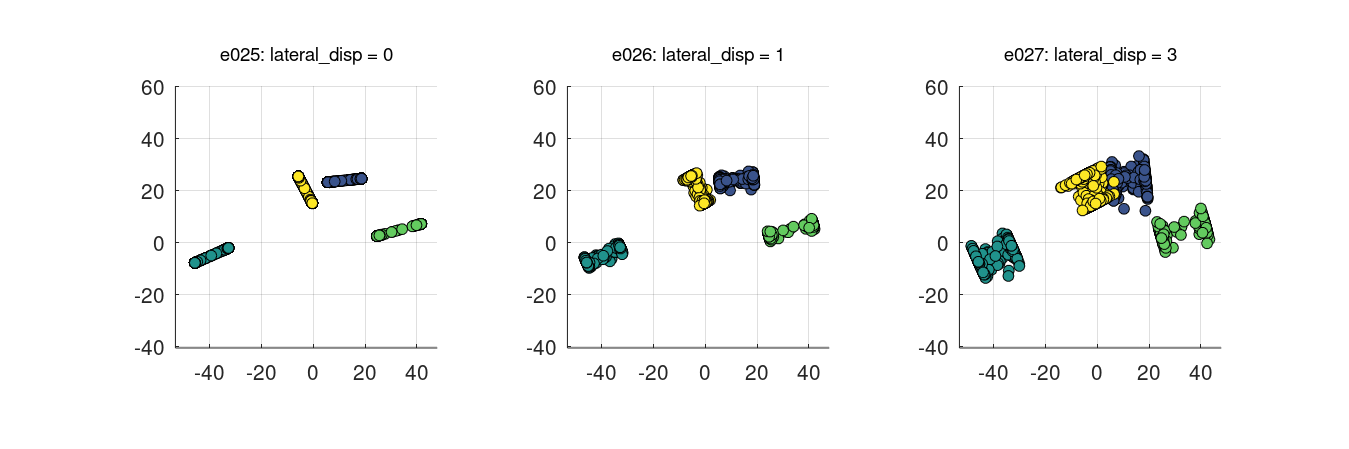
Custom projection placement using the Beta distribution
seed = 5678;

% Custom proj_dist_fn: point projections placed using the Beta distribution
% (requires MATLAB or Octave statistics toolbox)
proj_beta = @(len, n) len * betarnd(0.1, 0.1, [n 1]) - len / 2;

e025 = clugen(2, 4, 1000, [1 0], pi / 2, [20 20], 13, 2, 0.0, 'seed', seed, ...
    'proj_dist_fn', proj_beta);
e026 = clugen(2, 4, 1000, [1 0], pi / 2, [20 20], 13, 2, 1.0, 'seed', seed, ...
    'proj_dist_fn', proj_beta);
e027 = clugen(2, 4, 1000, [1 0], pi / 2, [20 20], 13, 2, 3.0, 'seed', seed, ...
    'proj_dist_fn', proj_beta);
plot_examples_2d(...
    e025, 'e025: lateral\_disp = 0', ...
    e026, 'e026: lateral\_disp = 1', ...
    e027, 'e027: lateral\_disp = 3');
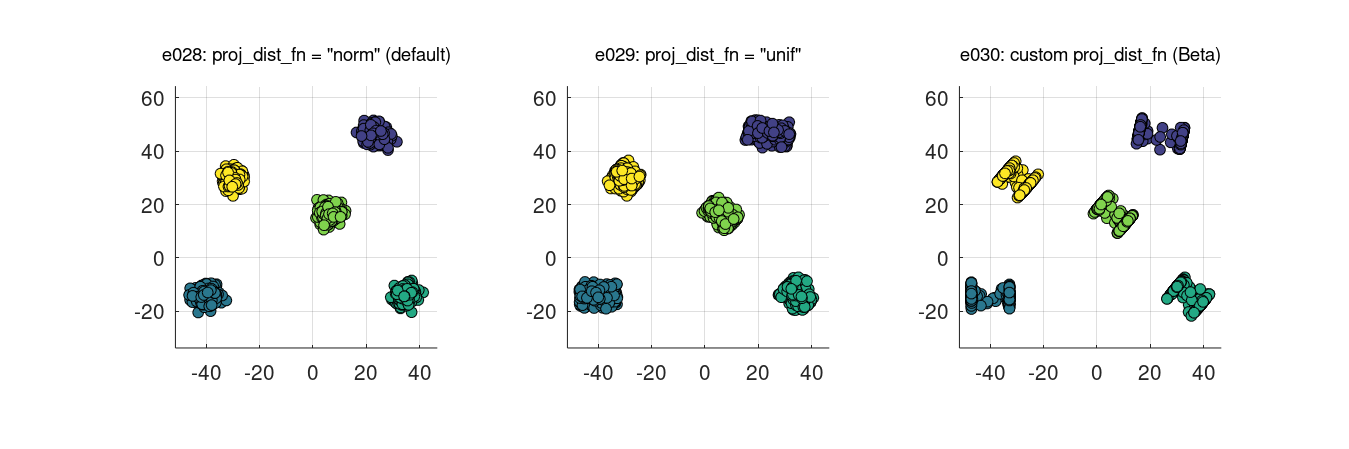
Controlling final point positions from their projections on the cluster-supporting line
Points on hyperplane orthogonal to cluster-supporting line (default): point_dist_fn = 'n-1'
seed = 5050;

% Custom proj_dist_fn: point projections placed using the Beta distribution
% (requires MATLAB or Octave statistics toolbox)
proj_beta = @(len, n) len * betarnd(0.03, 0.03, [n 1]) - len / 2;

e028 = clugen(2, 5, 1500, [1 0], pi / 3, [20 20], 12, 3, 2.0, 'seed', seed);
e029 = clugen(2, 5, 1500, [1 0], pi / 3, [20 20], 12, 3, 2.0, 'seed', seed, ...
    'proj_dist_fn', 'unif');
e030 = clugen(2, 5, 1500, [1 0], pi / 3, [20 20], 12, 3, 2.0, 'seed', seed, ...
    'proj_dist_fn', proj_beta);
plot_examples_2d(...
    e028, 'e028: proj\_dist\_fn = "norm" (default)', ...
    e029, 'e029: proj\_dist\_fn = "unif"', ...
    e030, 'e030: custom proj\_dist\_fn (Beta)');
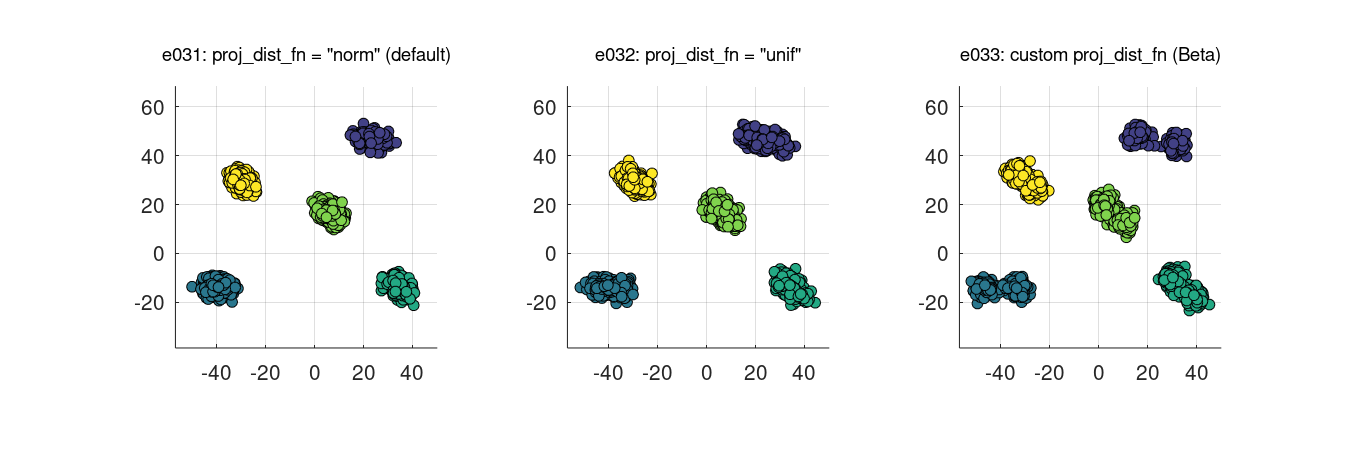
Points around projection on cluster-supporting line: point_dist_fn = 'n'
seed = 5050;

% Custom proj_dist_fn: point projections placed using the Beta distribution
% (requires MATLAB or Octave statistics toolbox)
proj_beta = @(len, n) len * betarnd(0.03, 0.03, [n 1]) - len / 2;

e031 = clugen(2, 5, 1500, [1 0], pi / 3, [20 20], 12, 3, 2.0, 'seed', seed, ...
    'point_dist_fn', 'n');
e032 = clugen(2, 5, 1500, [1 0], pi / 3, [20 20], 12, 3, 2.0, 'seed', seed, ...
    'point_dist_fn', 'n', 'proj_dist_fn', 'unif');
e033 = clugen(2, 5, 1500, [1 0], pi / 3, [20 20], 12, 3, 2.0, 'seed', seed, ...
    'point_dist_fn', 'n', 'proj_dist_fn', proj_beta);
plot_examples_2d(...
    e031, 'e031: proj\_dist\_fn = "norm" (default)', ...
    e032, 'e032: proj\_dist\_fn = "unif"', ...
    e033, 'e033: custom proj\_dist\_fn (Beta)');
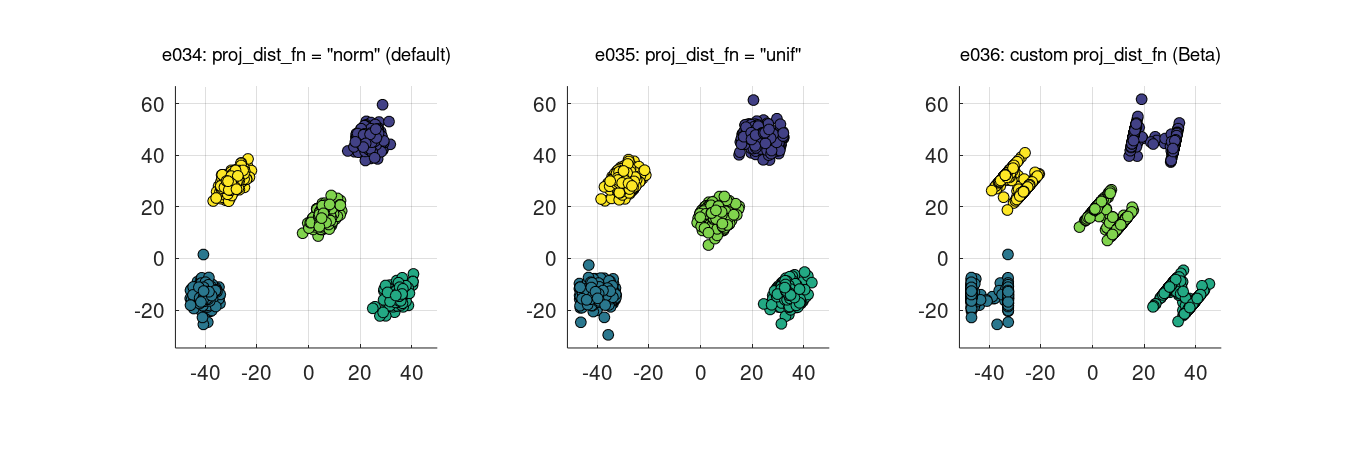
Custom point placement using the exponential distribution
seed = 5050;

% Custom point_dist_fn: final points placed using the Exponential distribution
% (requires MATLAB or Octave statistics toolbox)
clupoints_n_1_exp = @(projs, lat_std, len, clu_dir, clu_ctr) ...
    clupoints_n_1_template(projs, lat_std, clu_dir, ...
        @(npts, lstd) lstd * exprnd(2 / lstd, [npts 1]));

% Custom proj_dist_fn: point projections placed using the Beta distribution
% (requires MATLAB or Octave statistics toolbox)
proj_beta = @(len, n) len * betarnd(0.03, 0.03, [n 1]) - len / 2;

e034 = clugen(2, 5, 1500, [1 0], pi / 3, [20 20], 12, 3, 3.0, 'seed', seed, ...
    'point_dist_fn', clupoints_n_1_exp);
e035 = clugen(2, 5, 1500, [1 0], pi / 3, [20 20], 12, 3, 3.0, 'seed', seed, ...
    'point_dist_fn', clupoints_n_1_exp, 'proj_dist_fn', 'unif');
e036 = clugen(2, 5, 1500, [1 0], pi / 3, [20 20], 12, 3, 3.0, 'seed', seed, ...
    'point_dist_fn', clupoints_n_1_exp, 'proj_dist_fn', proj_beta);
plot_examples_2d(...
    e034, 'e034: proj\_dist\_fn = "norm" (default)', ...
    e035, 'e035: proj\_dist\_fn = "unif"', ...
    e036, 'e036: custom proj\_dist\_fn (Beta)');
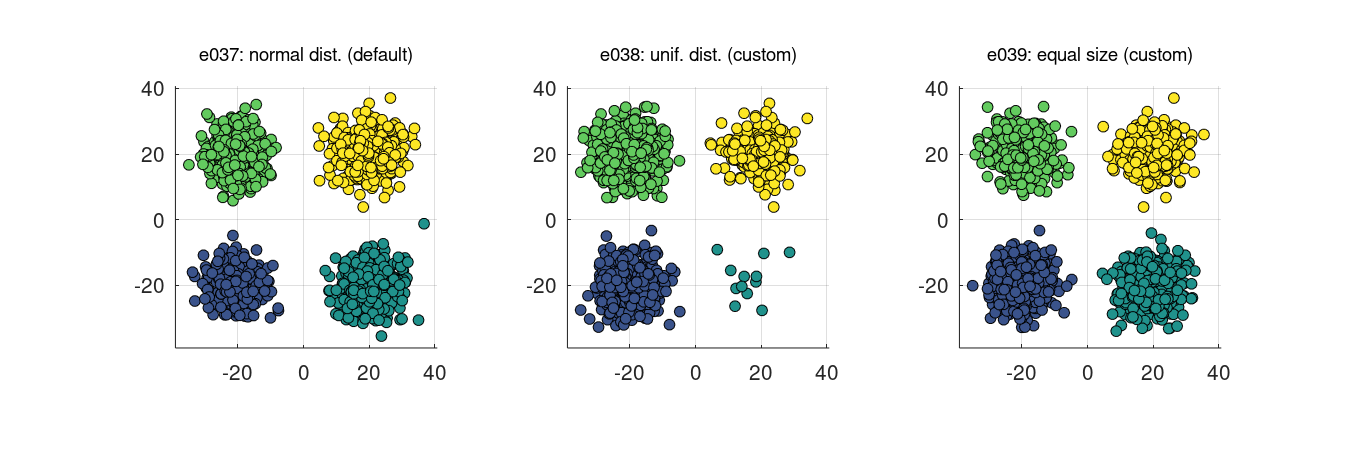
Manipulating cluster sizes
seed = 543210;

% Custom clusizes_fn (e038): cluster sizes determined via the uniform distribution,
% no correction for total points
clusizes_unif = @(nclu, npts, ae) randi(2 * npts / nclu, nclu, 1);

% Custom clusizes_fn (e039): clusters all have the same size, no correction for
% total points
clusizes_equal = @(nclu, npts, ae) floor(npts / nclu) * ones(nclu, 1);

% Custom clucenters_fn (all): yields fixed positions for the clusters
centers_fixed = @(nclu, csep, coff) ...
    [-csep(1) -csep(2); csep(1) -csep(2); -csep(1) csep(2); csep(1) csep(2)];

e037 = clugen(2, 4, 1500, [1 1], pi, [20 20], 0, 0, 5, 'seed', seed, ...
    'clucenters_fn', centers_fixed, 'point_dist_fn', 'n');
e038 = clugen(2, 4, 1500, [1 1], pi, [20 20], 0, 0, 5, 'seed', seed, ...
    'clucenters_fn', centers_fixed, 'clusizes_fn', clusizes_unif, 'point_dist_fn', 'n');
e039 = clugen(2, 4, 1500, [1 1], pi, [20 20], 0, 0, 5, 'seed', seed, ...
    'clucenters_fn', centers_fixed, 'clusizes_fn', clusizes_equal, 'point_dist_fn', 'n');
plot_examples_2d(...
    e037, 'e037: normal dist. (default)', ...
    e038, 'e038: unif. dist. (custom)', ...
    e039, 'e039: equal size (custom)');
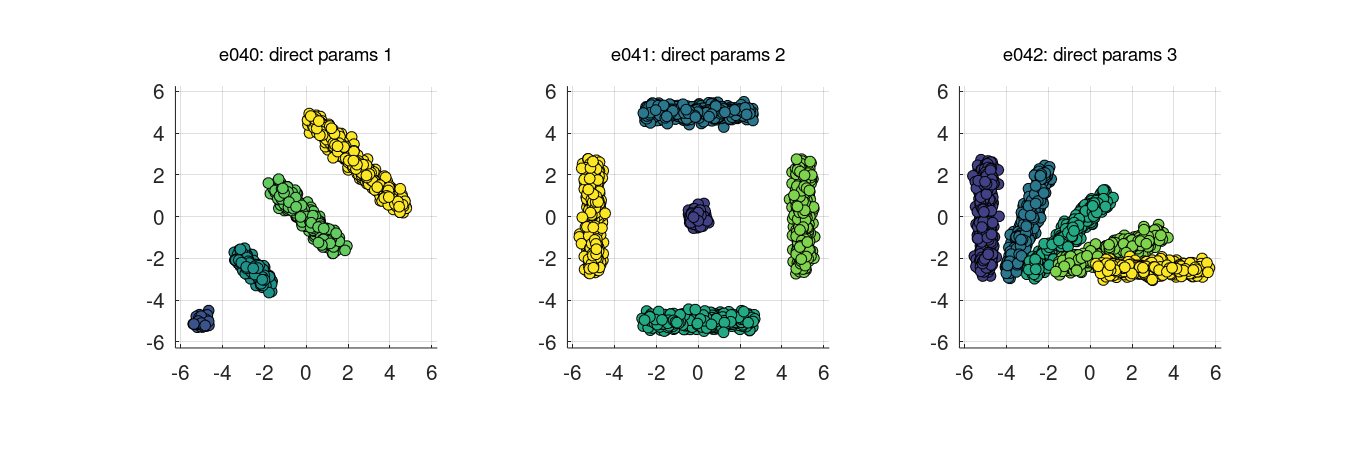
Direct specification of optional parameters
seed = 123;

e040 = clugen(2, 4, 1000, [-1 1], 0, [0 0], 0, 0, 0.2, ...
    'seed', seed, 'proj_dist_fn', 'unif', 'point_dist_fn', 'n', ...
    'clusizes_fn', [50 200 500 500], 'llengths_fn', [0 2 4 6], ...
    'clucenters_fn', [-5 -5; -2.5 -2.5; 0 0; 2.5 2.5]);
e041 = clugen(2, 5, 1000, [1 1; 1 0; 1 0; 0 1; 0 1], 0, [0 0], 0, 0, 0.2, ...
    'seed', seed, 'proj_dist_fn', 'unif', 'point_dist_fn', 'n', ...
    'clusizes_fn', [200 500 500 500 500], 'llengths_fn', [0, 5, 5, 5, 5], ...
    'clucenters_fn', [0 0; 0 5; 0 -5; 5 0; -5 0]);
e042 = clugen(2, 5, 1000, [0 1; 0.25 0.75; 0.5 0.5; 0.75 0.25; 1 0], 0, [0 0], 5, 0, 0.2, ...
    'seed', seed, 'proj_dist_fn', 'unif', 'point_dist_fn', 'n', ...
    'clusizes_fn', 500 * ones(5, 1), 'clucenters_fn', [-5 0; -3 -0.3; -1 -0.8; 1 -1.6; 3 -2.5]);
plot_examples_2d(...
    e040, 'e040: direct params 1', ...
    e041, 'e041: direct params 2', ...
    e042, 'e042: direct params 3');
Examples in 3D
These examples were plotted with the plot_examples_3d() helper function available
here.
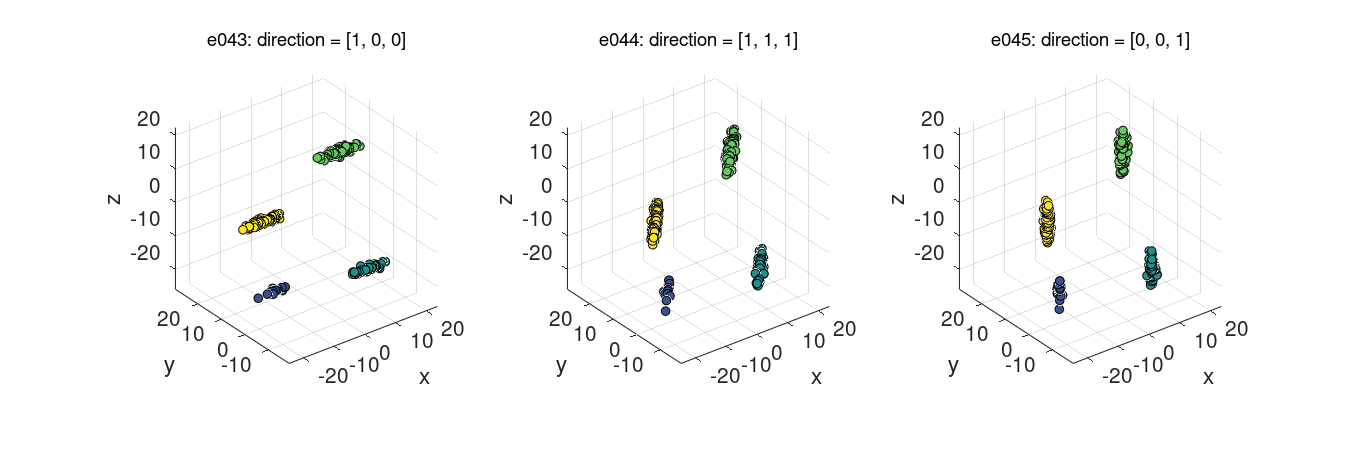
Manipulating the direction of cluster-supporting lines
Using the direction parameter
seed = 1;

e043 = clugen(3, 4, 500, [1 0 0], 0, [10 10 10], 15, 1.5, 0.5, 'seed', seed);
e044 = clugen(3, 4, 500, [1 1 1], 0, [10 10 10], 15, 1.5, 0.5, 'seed', seed);
e045 = clugen(3, 4, 500, [0 0 1], 0, [10 10 10], 15, 1.5, 0.5, 'seed', seed);
plot_examples_3d(...
    e043, 'e043: direction = [1, 0, 0]', ...
    e044, 'e044: direction = [1, 1, 1]', ...
    e045, 'e045: direction = [0, 0, 1]');
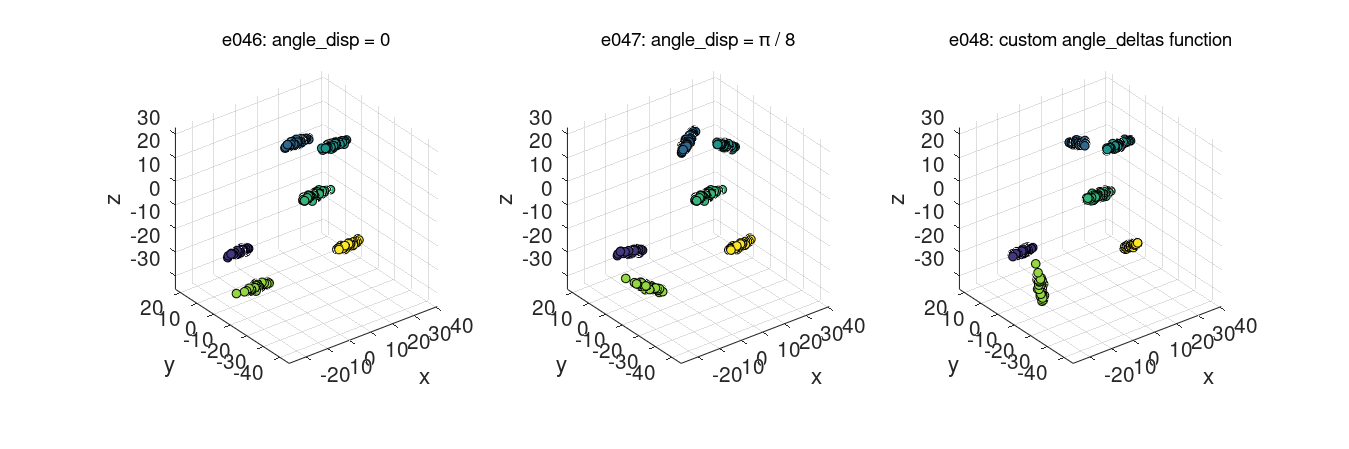
Changing the angle_disp parameter and using a custom angle_deltas_fn function
seed = 9876;

% Custom angle_deltas function: arbitrarily rotate some clusters by 90 degrees
% Requires the statistics toolbox in either Octave or MATLAB
angdel_90 = @(nclu, astd) randsample([0 pi/2], nclu, true);

e046 = clugen(3, 6, 1000, [1 0 0], 0, [10 10 10], 15, 1.5, 0.5, 'seed', seed);
e047 = clugen(3, 6, 1000, [1 0 0], pi / 8, [10 10 10], 15, 1.5, 0.5, 'seed', seed);
e048 = clugen(3, 6, 1000, [1 0 0], 0, [10 10 10], 15, 1.5, 0.5, 'seed', seed, 'angle_deltas_fn', angdel_90);
plot_examples_3d(...
    e046, 'e046: angle\_disp = 0', ...
    e047, 'e047: angle\_disp = π / 8', ...
    e048, 'e048: custom angle\_deltas function');
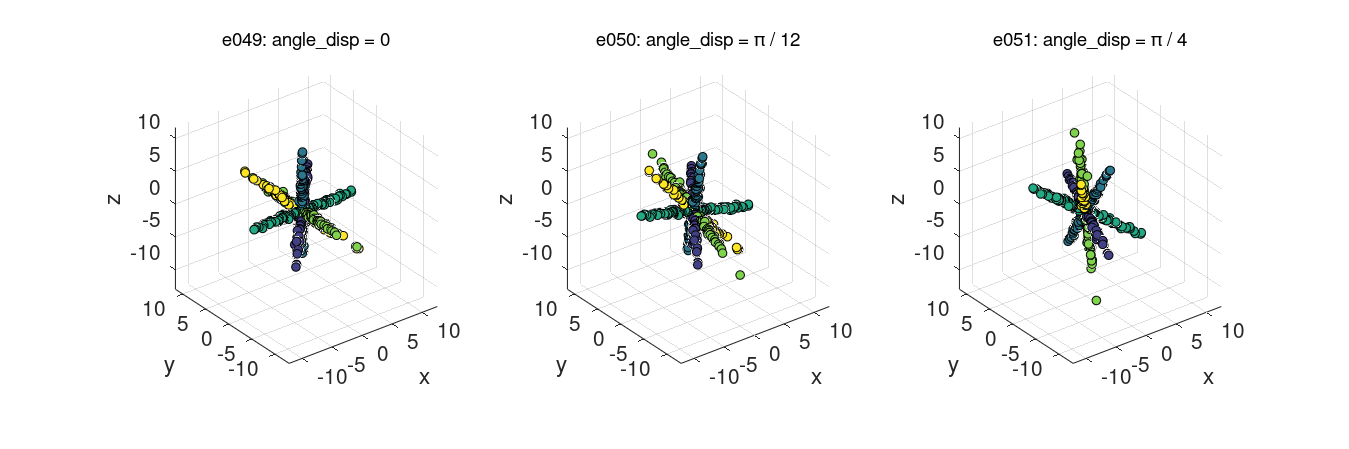
Specifying a main direction for each cluster and changing angle_disp
seed = 9876;

% Define a main direction for each cluster
dirs = [1 1 1; 0 0 1; 1 0 0; 0 1 0; -1 1 1];

e049 = clugen(3, 5, 1000, dirs, 0, [0 0 0], 20, 0, 0.2, 'seed', seed);
e050 = clugen(3, 5, 1000, dirs, pi / 12, [0 0 0], 20, 0, 0.2, 'seed', seed);
e051 = clugen(3, 5, 1000, dirs, pi / 4, [0 0 0], 20, 0, 0.2, 'seed', seed);
plot_examples_3d(...
    e049, 'e049: angle\_disp = 0', ...
    e050, 'e050: angle\_disp = π / 12', ...
    e051, 'e051: angle\_disp = π / 4');
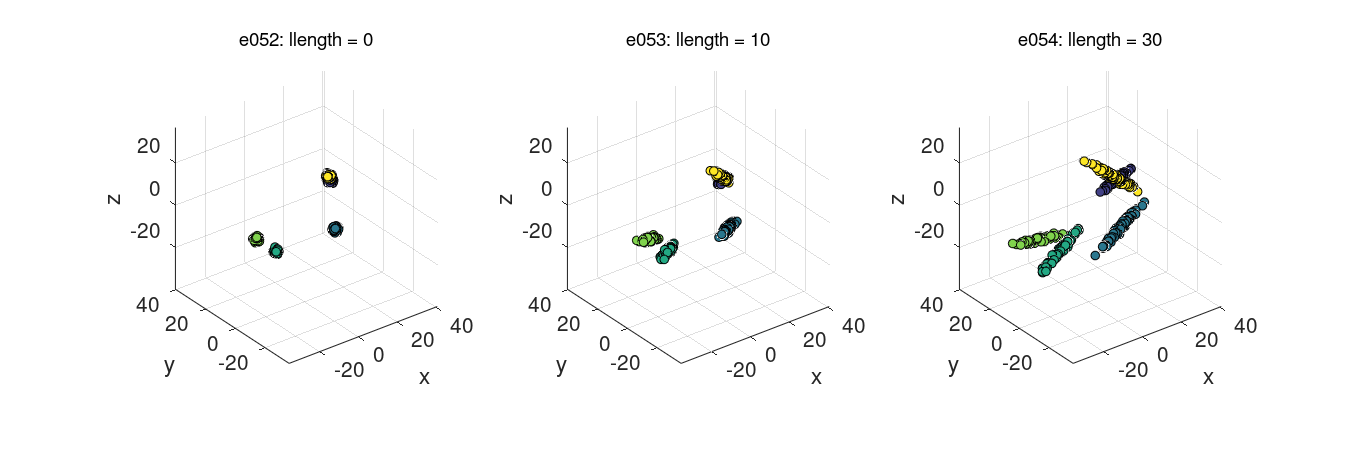
Manipulating the length of cluster-supporting lines
Using the llength parameter
seed = 2;

e052 = clugen(3, 5, 800, [1 0 0], pi / 10, [10 10 10], 0, 0, 0.5, 'seed', seed, 'point_dist_fn', 'n');
e053 = clugen(3, 5, 800, [1 0 0], pi / 10, [10 10 10], 10, 0, 0.5, 'seed', seed, 'point_dist_fn', 'n');
e054 = clugen(3, 5, 800, [1 0 0], pi / 10, [10 10 10], 30, 0, 0.5, 'seed', seed, 'point_dist_fn', 'n');
plot_examples_3d(...
    e052, 'e052: llength = 0', ...
    e053, 'e053: llength = 10', ...
    e054, 'e054: llength = 30');
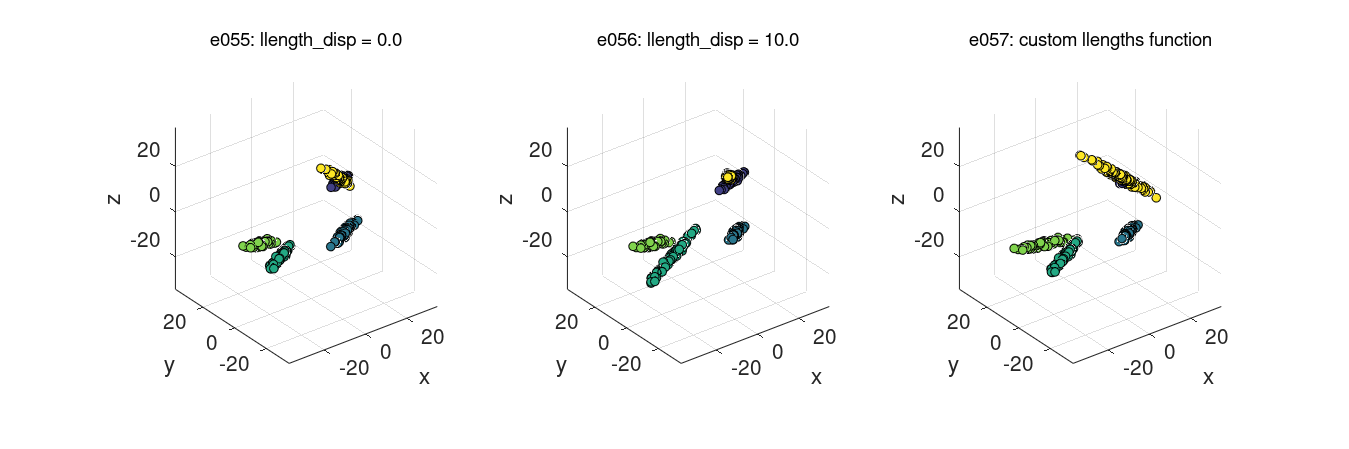
Changing the llength_disp parameter and using a custom llengths_fn function
seed = 2;

% Custom llengths function: line lengths tend to grow for each new cluster
llen_grow = @(nclu, llen, llenstd) llen * (0:(nclu - 1))' + llenstd * randn(nclu, 1);

e055 = clugen(3, 5, 800, [1 0 0], pi / 10, [10 10 10], 15,  0.0, 0.5, 'seed', seed, ...
    'point_dist_fn', 'n');
e056 = clugen(3, 5, 800, [1 0 0], pi / 10, [10 10 10], 15, 10.0, 0.5, 'seed', seed, ...
    'point_dist_fn', 'n');
e057 = clugen(3, 5, 800, [1 0 0], pi / 10, [10 10 10], 10,  0.1, 0.5, 'seed', seed, ...
    'llengths_fn', llen_grow, 'point_dist_fn', 'n');
plot_examples_3d(...
    e055, 'e055: llength\_disp = 0.0', ...
    e056, 'e056: llength\_disp = 10.0', ...
    e057, 'e057: custom llengths function');
Manipulating relative cluster positions
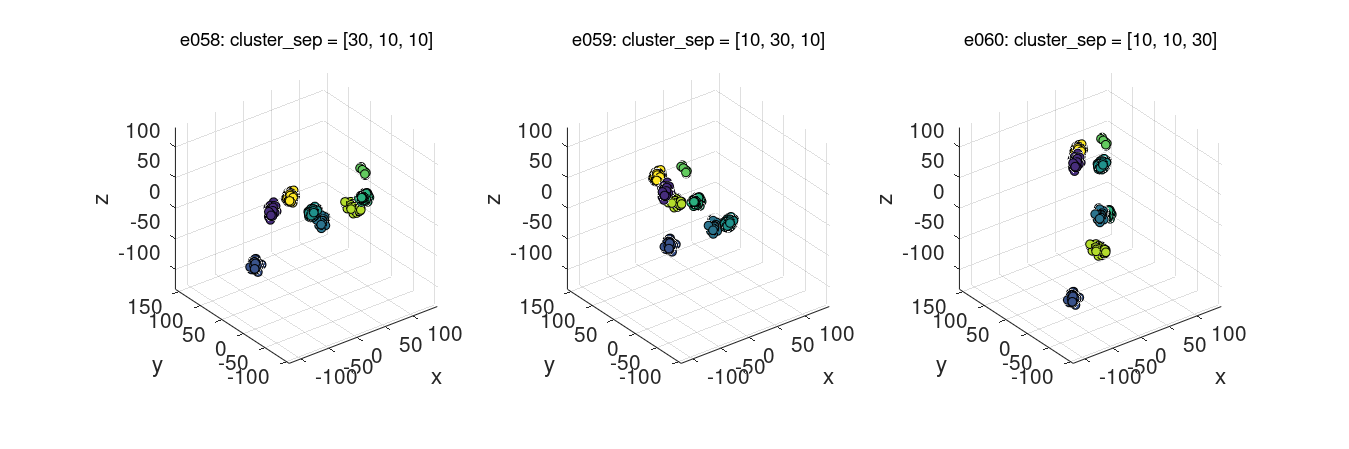
Using the cluster_sep parameter
seed = 321;

e058 = clugen(3, 8, 1000, [1 1 1], pi / 4, [30 10 10], 25, 4, 3, 'seed', seed);
e059 = clugen(3, 8, 1000, [1 1 1], pi / 4, [10 30 10], 25, 4, 3, 'seed', seed);
e060 = clugen(3, 8, 1000, [1 1 1], pi / 4, [10 10 30], 25, 4, 3, 'seed', seed);
plot_examples_3d(...
    e058, 'e058: cluster\_sep = [30, 10, 10]', ...
    e059, 'e059: cluster\_sep = [10, 30, 10]', ...
    e060, 'e060: cluster\_sep = [10, 10, 30]');
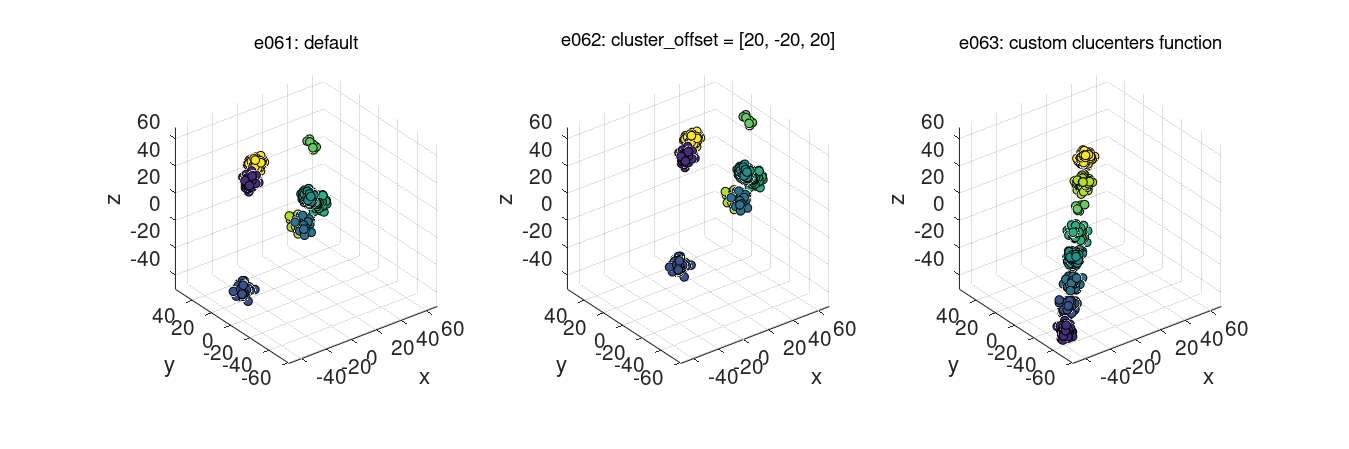
Changing the cluster_offset parameter and using a custom clucenters_fn function
seed = 321;

% Custom clucenters function: places clusters in a diagonal
centers_diag = @(nclu, csep, coff) ones(nclu, numel(csep)) .* (1:nclu)' * max(csep) + coff';

e061 = clugen(3, 8, 1000, [1 1 1], pi / 4, [10 10 10], 12, 3, 2.5, 'seed', seed);
e062 = clugen(3, 8, 1000, [1 1 1], pi / 4, [10 10 10], 12, 3, 2.5, 'seed', seed, ...
    'cluster_offset', [20 -20 20]);
e063 = clugen(3, 8, 1000, [1, 1, 1], pi / 4, [10, 10, 10], 12, 3, 2.5, 'seed', seed, ...
    'cluster_offset',  [-50 -50 -50], 'clucenters_fn', centers_diag);
plot_examples_3d(...
    e061, 'e061: default', ...
    e062, 'e062: cluster\_offset = [20, -20, 20]', ...
    e063, 'e063: custom clucenters function');
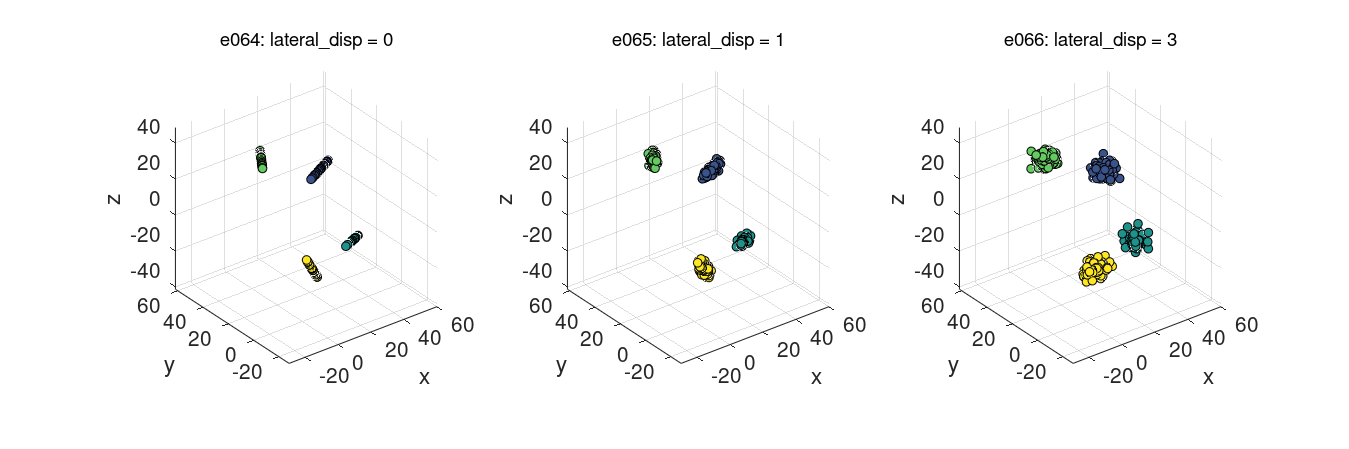
Lateral dispersion and placement of point projections on the line
Normal projection placement (default): proj_dist_fn = 'norm'
seed = 456;

e064 = clugen(3, 4, 1000, [1 0 0], pi / 2, [20 20 20], 13, 2, 0.0, 'seed', seed);
e065 = clugen(3, 4, 1000, [1 0 0], pi / 2, [20 20 20], 13, 2, 1.0, 'seed', seed);
e066 = clugen(3, 4, 1000, [1 0 0], pi / 2, [20 20 20], 13, 2, 3.0, 'seed', seed);
plot_examples_3d(...
    e064, 'e064: lateral\_disp = 0', ...
    e065, 'e065: lateral\_disp = 1', ...
    e066, 'e066: lateral\_disp = 3');
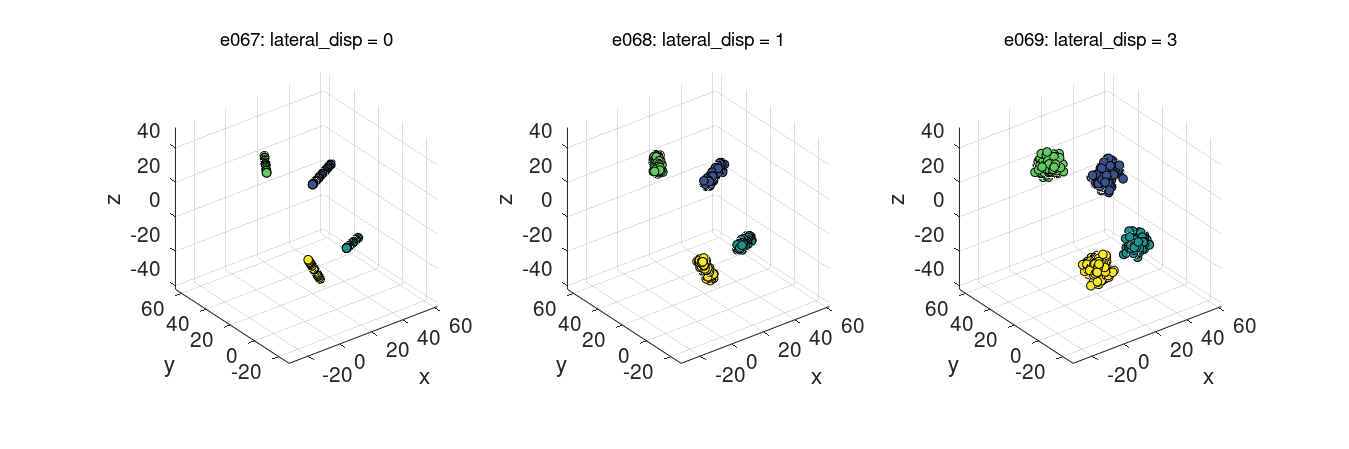
Uniform projection placement: proj_dist_fn = 'unif'
seed = 456;

e067 = clugen(3, 4, 1000, [1 0 0], pi / 2, [20 20 20], 13, 2, 0.0, 'seed', seed, 'proj_dist_fn', 'unif');
e068 = clugen(3, 4, 1000, [1 0 0], pi / 2, [20 20 20], 13, 2, 1.0, 'seed', seed, 'proj_dist_fn', 'unif');
e069 = clugen(3, 4, 1000, [1 0 0], pi / 2, [20 20 20], 13, 2, 3.0, 'seed', seed, 'proj_dist_fn', 'unif');
plot_examples_3d(...
    e067, 'e067: lateral\_disp = 0', ...
    e068, 'e068: lateral\_disp = 1', ...
    e069, 'e069: lateral\_disp = 3');
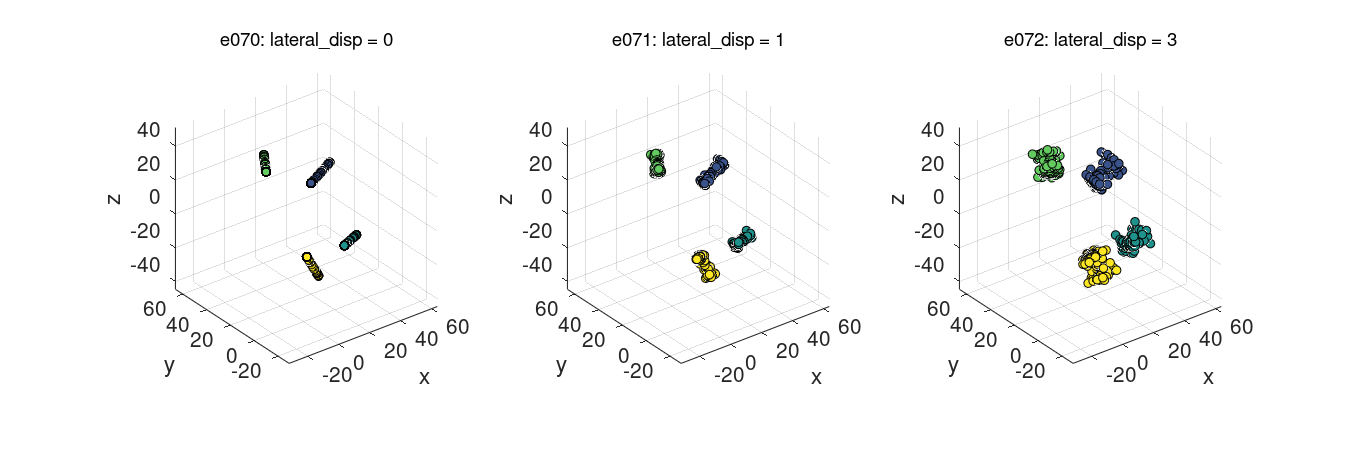
Custom projection placement using the Beta distribution
seed = 456;

% Custom proj_dist_fn: point projections placed using the Beta distribution
% (requires MATLAB or Octave statistics toolbox)
proj_beta = @(len, n) len * betarnd(0.1, 0.1, [n 1]) - len / 2;

e070 = clugen(3, 4, 1000, [1 0 0], pi / 2, [20 20 20], 13, 2, 0.0, 'seed', seed, 'proj_dist_fn', proj_beta);
e071 = clugen(3, 4, 1000, [1 0 0], pi / 2, [20 20 20], 13, 2, 1.0, 'seed', seed, 'proj_dist_fn', proj_beta);
e072 = clugen(3, 4, 1000, [1 0 0], pi / 2, [20 20 20], 13, 2, 3.0, 'seed', seed, 'proj_dist_fn', proj_beta);
plot_examples_3d(...
    e070, 'e070: lateral\_disp = 0', ...
    e071, 'e071: lateral\_disp = 1', ...
    e072, 'e072: lateral\_disp = 3');
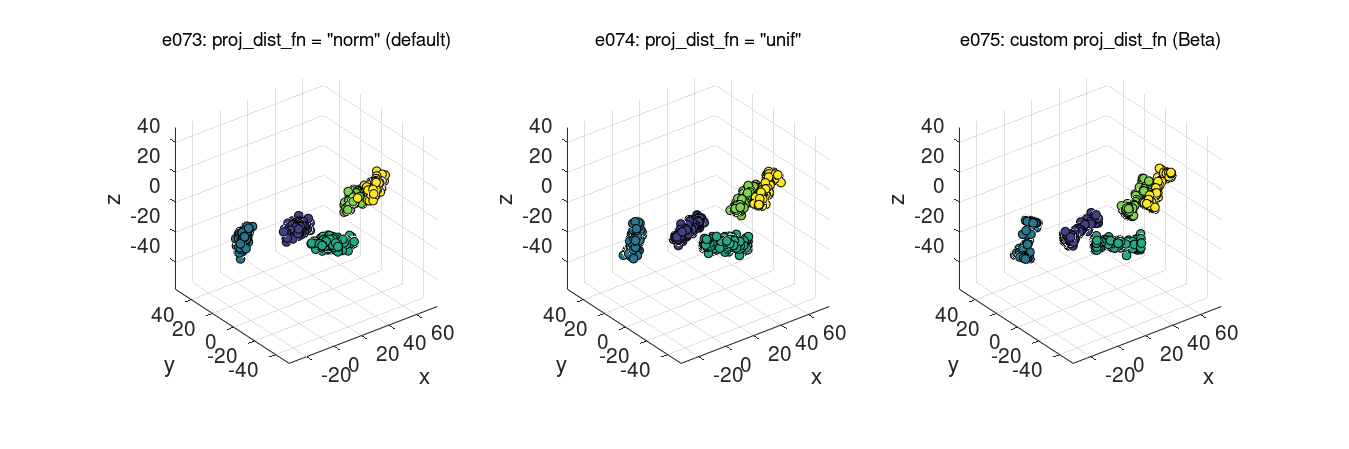
Controlling final point positions from their projections on the cluster-supporting line
Points on hyperplane orthogonal to cluster-supporting line (default): point_dist_fn = "n-1"
seed = 34;

% Custom proj_dist_fn: point projections placed using the Beta distribution
% (requires MATLAB or Octave statistics toolbox)
proj_beta = @(len, n) len * betarnd(0.1, 0.1, [n 1]) - len / 2;

e073 = clugen(3, 5, 1500, [1 0 0], pi / 3, [20 20 20], 22, 3, 2, 'seed', seed);
e074 = clugen(3, 5, 1500, [1 0 0], pi / 3, [20 20 20], 22, 3, 2, 'seed', seed, 'proj_dist_fn', 'unif');
e075 = clugen(3, 5, 1500, [1 0 0], pi / 3, [20 20 20], 22, 3, 2, 'seed', seed, 'proj_dist_fn', proj_beta);
plot_examples_3d(...
    e073, 'e073: proj\_dist\_fn = "norm" (default)', ...
    e074, 'e074: proj\_dist\_fn = "unif"', ...
    e075, 'e075: custom proj\_dist\_fn (Beta)');
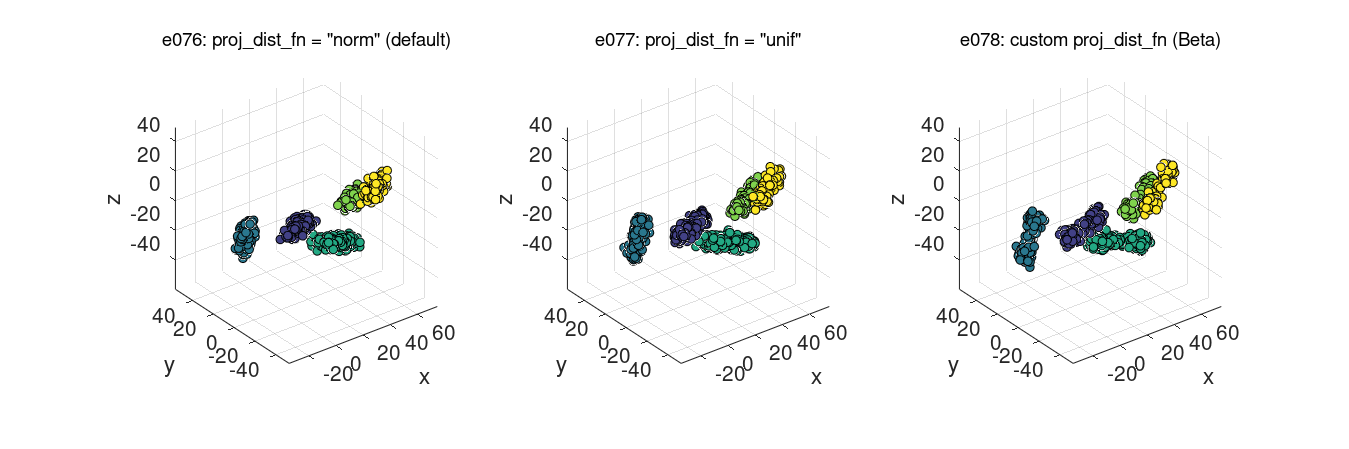
Points around projection on cluster-supporting line: point_dist_fn = "n"
seed = 34;

% Custom proj_dist_fn: point projections placed using the Beta distribution
% (requires MATLAB or Octave statistics toolbox)
proj_beta = @(len, n) len * betarnd(0.1, 0.1, [n 1]) - len / 2;

e076 = clugen(3, 5, 1500, [1 0 0], pi / 3, [20 20 20], 22, 3, 2, 'seed', seed, ...
    'point_dist_fn', 'n');
e077 = clugen(3, 5, 1500, [1 0 0], pi / 3, [20 20 20], 22, 3, 2, 'seed', seed, ...
    'point_dist_fn', 'n', 'proj_dist_fn', 'unif');
e078 = clugen(3, 5, 1500, [1 0 0], pi / 3, [20 20 20], 22, 3, 2, 'seed', seed, ...
    'point_dist_fn', 'n', 'proj_dist_fn', proj_beta);
plot_examples_3d(...
    e076, 'e076: proj\_dist\_fn = "norm" (default)', ...
    e077, 'e077: proj\_dist\_fn = "unif"', ...
    e078, 'e078: custom proj\_dist\_fn (Beta)');
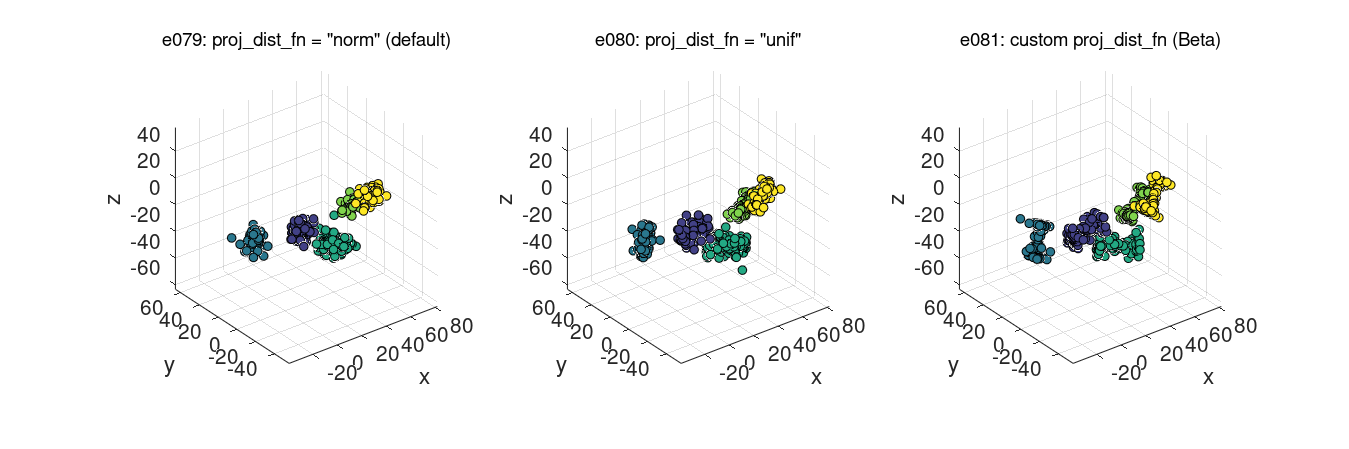
Custom point placement using the exponential distribution
seed = 34;

% Custom point_dist_fn: final points placed using the Exponential distribution
% (requires MATLAB or Octave statistics toolbox)
clupoints_n_1_exp = @(projs, lat_std, len, clu_dir, clu_ctr) ...
    clupoints_n_1_template(projs, lat_std, clu_dir, ...
        @(npts, lstd) lstd * exprnd(2 / lstd, [npts 1]));

% Custom proj_dist_fn: point projections placed using the Beta distribution
% (requires MATLAB or Octave statistics toolbox)
proj_beta = @(len, n) len * betarnd(0.1, 0.1, [n 1]) - len / 2;

e079 = clugen(3, 5, 1500, [1 0 0], pi / 3, [20 20, 20], 22, 3, 2, 'seed', seed, ...
    'point_dist_fn', clupoints_n_1_exp);
e080 = clugen(3, 5, 1500, [1 0 0], pi / 3, [20 20 20], 22, 3, 2, 'seed', seed, ...
    'point_dist_fn', clupoints_n_1_exp, 'proj_dist_fn', 'unif');
e081 = clugen(3, 5, 1500, [1 0 0], pi / 3, [20 20 20], 22, 3, 2, 'seed', seed, ...
    'point_dist_fn', clupoints_n_1_exp, 'proj_dist_fn', proj_beta);
plot_examples_3d(...
    e079, 'e079: proj\_dist\_fn = "norm" (default)', ...
    e080, 'e080: proj\_dist\_fn = "unif"', ...
    e081, 'e081: custom proj\_dist\_fn (Beta)');
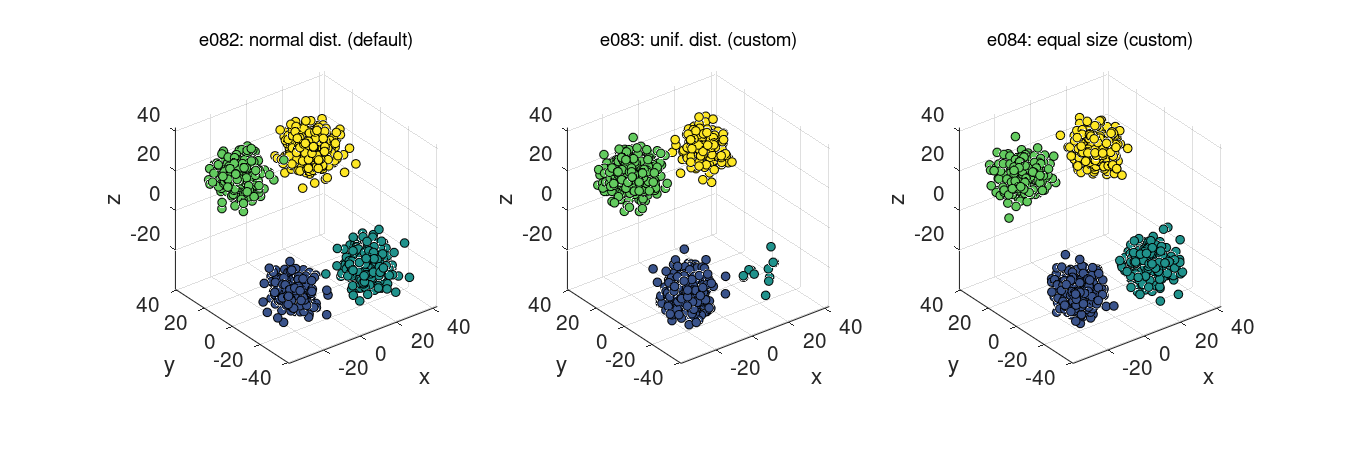
Manipulating cluster sizes
seed = 543210;

% Custom clusizes_fn (e083): cluster sizes determined via the uniform distribution,
% no correction for total points
clusizes_unif = @(nclu, npts, ae) randi(2 * npts / nclu, nclu, 1);

% Custom clusizes_fn (e084): clusters all have the same size, no correction for
% total points
clusizes_equal = @(nclu, npts, ae) floor(npts / nclu) * ones(nclu, 1);

% Custom clucenters_fn (all): yields fixed positions for the clusters
centers_fixed = @(nclu, csep, coff) ...
    [-csep(1) -csep(2) -csep(3); csep(1) -csep(2) -csep(3); ...
     -csep(1)  csep(2)  csep(3); csep(1)  csep(2)  csep(3)];

e082 = clugen(3, 4, 1500, [1 1 1], pi, [20 20 20], 0, 0, 5, 'seed', seed, ...
    'clucenters_fn', centers_fixed, 'point_dist_fn', 'n');
e083 = clugen(3, 4, 1500, [1 1 1], pi, [20 20 20], 0, 0, 5, 'seed', seed, ...
    'clucenters_fn', centers_fixed, 'clusizes_fn', clusizes_unif, 'point_dist_fn', 'n');
e084 = clugen(3, 4, 1500, [1 1 1], pi, [20 20 20], 0, 0, 5, 'seed', seed, ...
    'clucenters_fn', centers_fixed, 'clusizes_fn', clusizes_equal, 'point_dist_fn', 'n');
plot_examples_3d(...
    e082, 'e082: normal dist. (default)', ...
    e083, 'e083: unif. dist. (custom)', ...
    e084, 'e084: equal size (custom)');
Examples in other dimensions
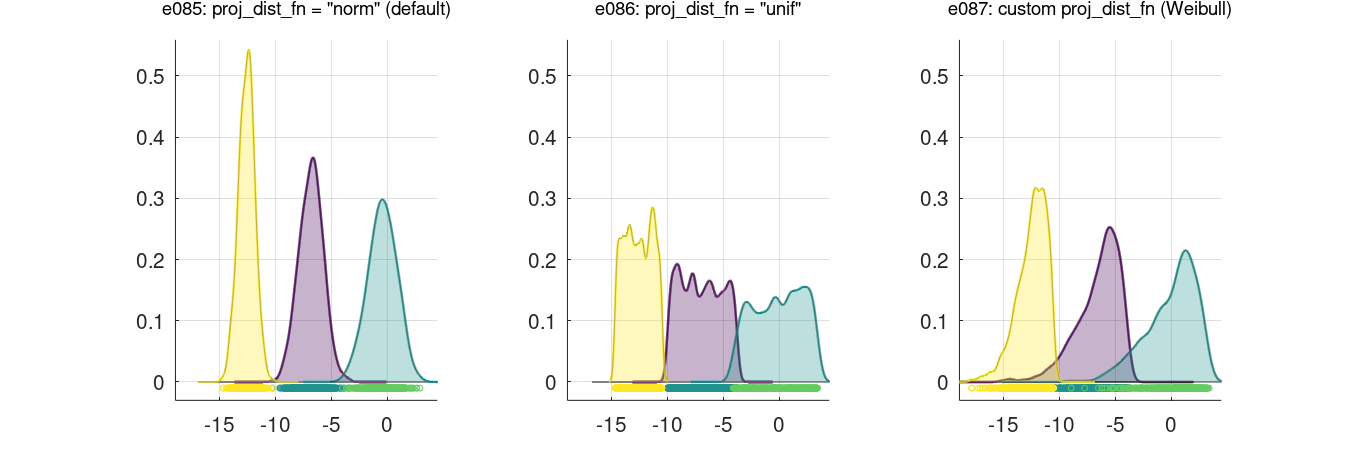
Basic 1D example with density plot
These examples was plotted with the plot_examples_1d() helper function available
here.
% Custom proj_dist_fn: point projections placed using the Weibull distribution
% (requires MATLAB or Octave statistics toolbox)
proj_wbull = @(len, n) wblrnd(len / 2, 1.5, [n 1]) - len / 2;


e085 = clugen(1, 3, 2000, 1, 0, 10, 6, 1.5, 0, 'seed', 45);
e086 = clugen(1, 3, 2000, 1, 0, 10, 6, 1.5, 0, 'seed', 45, 'proj_dist_fn', 'unif');
e087 = clugen(1, 3, 2000, 1, 0, 10, 6, 1.5, 0, 'seed', 45, 'proj_dist_fn', proj_wbull);
plot_examples_1d(...
    e085, 'e085: proj\_dist\_fn = "norm" (default)', ...
    e086, 'e086: proj\_dist\_fn = "unif"', ...
    e087, 'e087: custom proj\_dist\_fn (Weibull)');
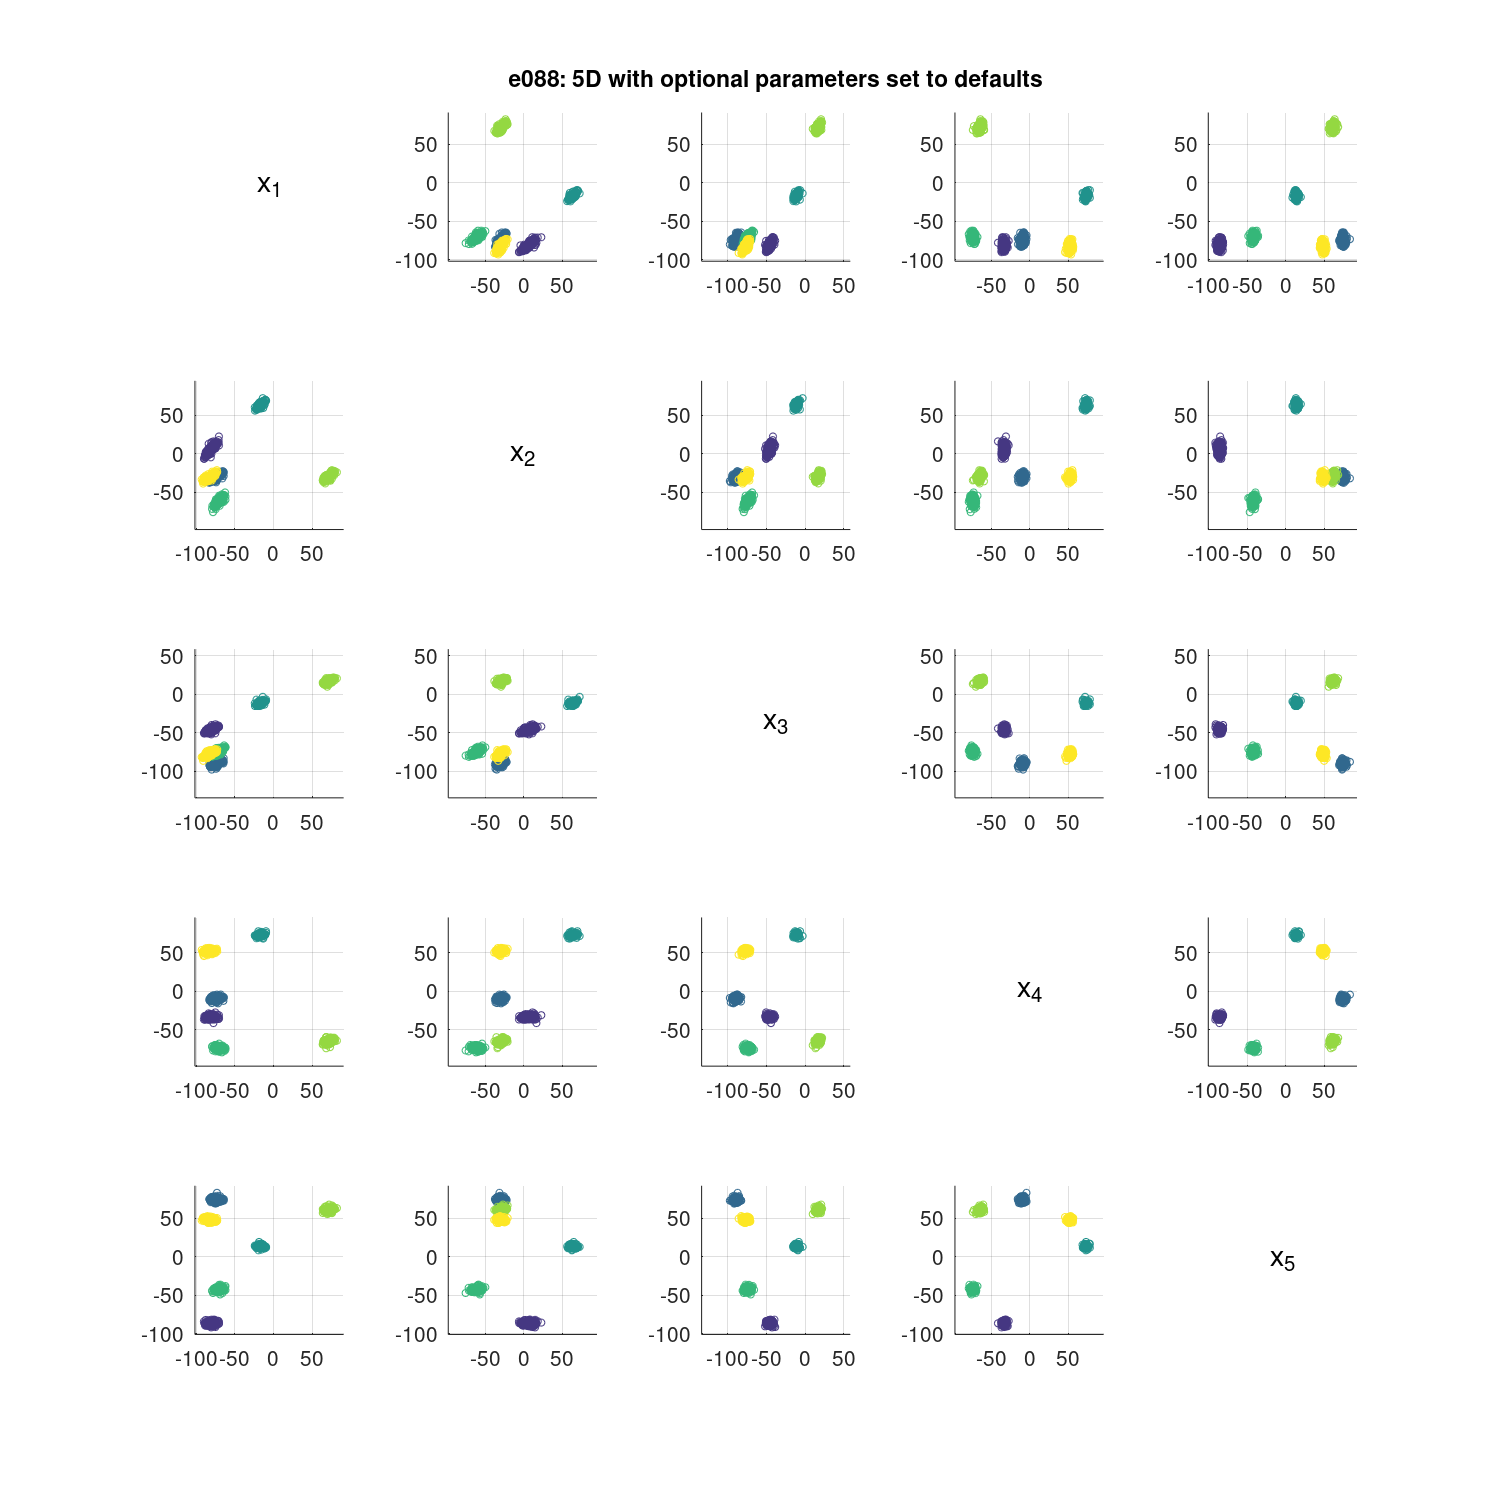
5D example with default optional arguments
These examples were plotted with the plot_examples_nd() helper function available
here.
nd = 5;
seed = 123;

e088 = clugen(nd, 6, 1500, [1 1 0.5 0 0], pi / 16, 30 * ones(nd, 1), 30, 4, 3, 'seed', seed);
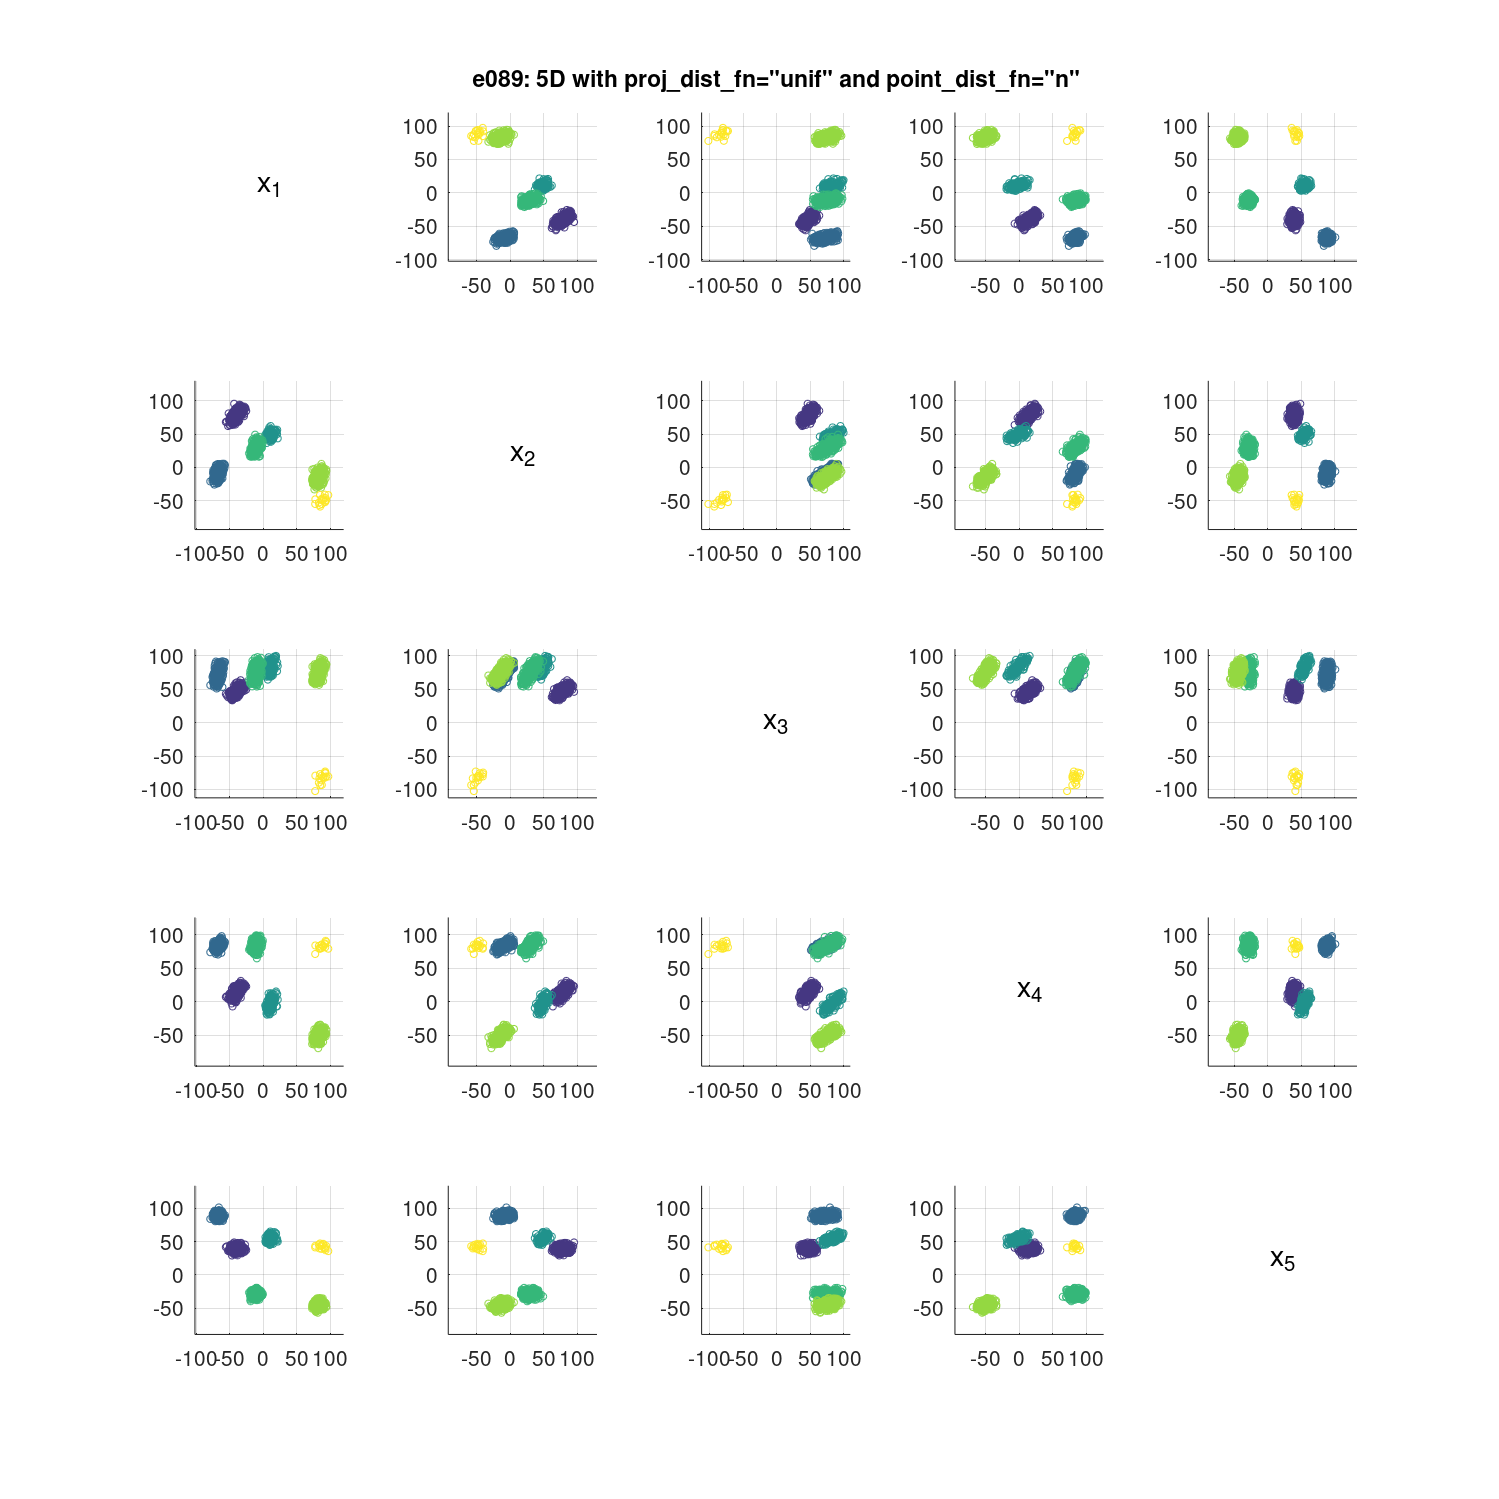
5D example with proj_dist_fn = "unif" and point_dist_fn = "n"
nd = 5;
seed = 321;

e089 = clugen(nd, 6, 1500, [0.1 0.3 0.5 0.3 0.1], pi / 12, 30 * ones(nd, 1), 35, 5, 3.5, 'seed', seed, ...
    'proj_dist_fn', 'unif', 'point_dist_fn', 'n');
Merging and hierarchical cluster examples
This section contains several examples on how to merge cluster data, either
generated with MOCluGen or from other sources. Although it is possible to
merge data in any dimension, these examples will focus on merging 2D data.
Therefore, we'll use the same plot_examples_2d() function used for the
2D examples.
Merging two data sets generated with clugen()
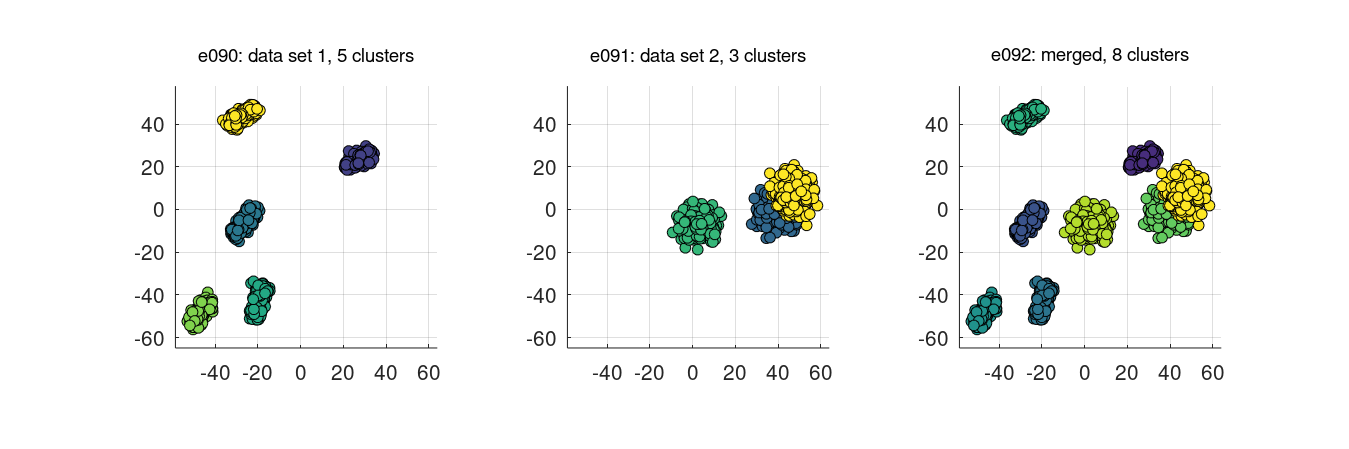
seed1 = 222;
seed2 = 111;

e090 = clugen(2, 5, 1000, [1 1], pi / 12, [20 20], 14, 1.2, 1.5, 'seed', seed1, ...
    'proj_dist_fn', 'unif', 'point_dist_fn', 'n');
e091 = clugen(2, 3, 1500, [1 0], 0.05, [20 20], 0, 0, 4, 'seed', seed2, ...
    'point_dist_fn', 'n', 'cluster_offset', [20 0]);
e092 = clumerge({e090, e091});
plot_examples_2d(...
    e090, 'e090: data set 1, 5 clusters', ...
    e091, 'e091: data set 2, 3 clusters', ...
    e092, 'e092: merged, 8 clusters');
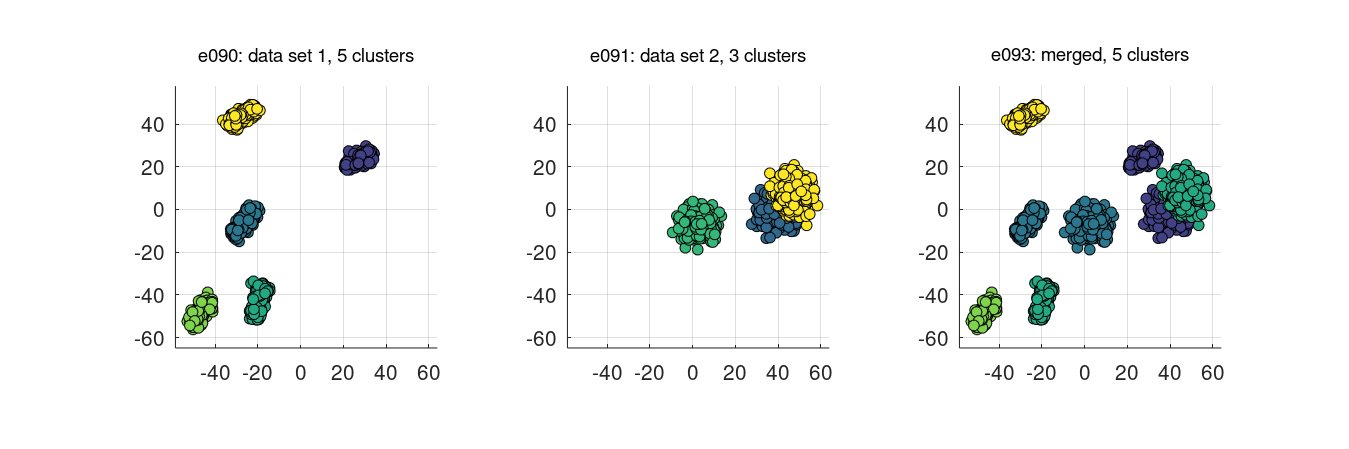
In the previous example, clusters from individual data sets remain as separate
clusters in the merged data set. It's also possible to mantain the original
cluster labels by setting the clusters_field parameter to an empty string:
plot_examples_2d(...
    e090, 'e090: data set 1, 5 clusters', ...
    e091, 'e091: data set 2, 3 clusters', ...
    e093, 'e093: merged, 5 clusters');
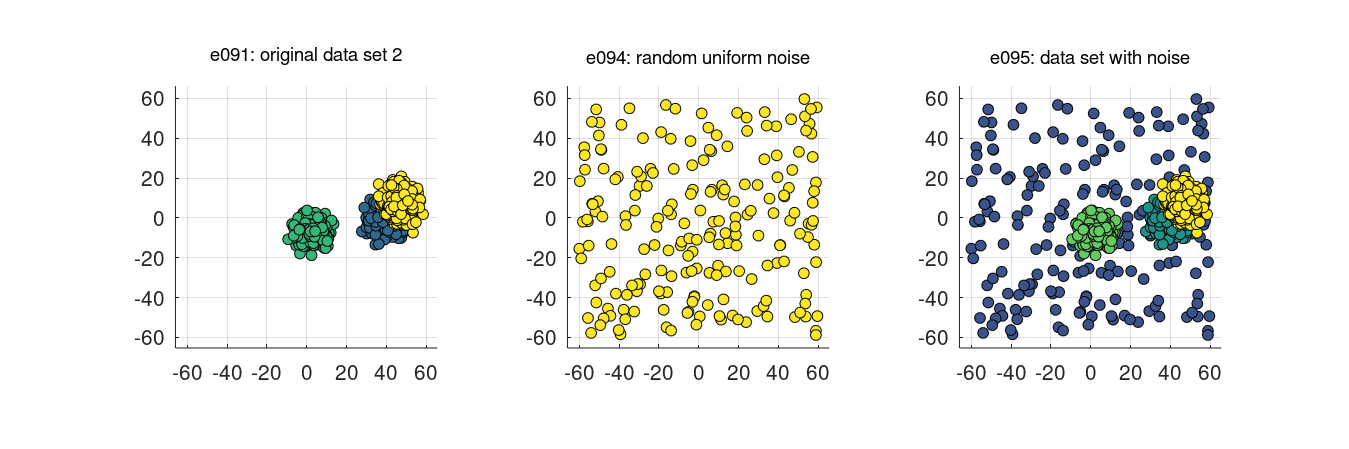
Adding noise to a clugen()-generated data set
cluseed(333);

e094 = struct('points', 120 * rand(200, 2) - 60, 'clusters', ones(200, 1, 'int64'));
e095 = clumerge({e094, e091});
plot_examples_2d(...
    e091, 'e091: original data set 2', ...
    e094, 'e094: random uniform noise', ...
    e095, 'e095: data set with noise');
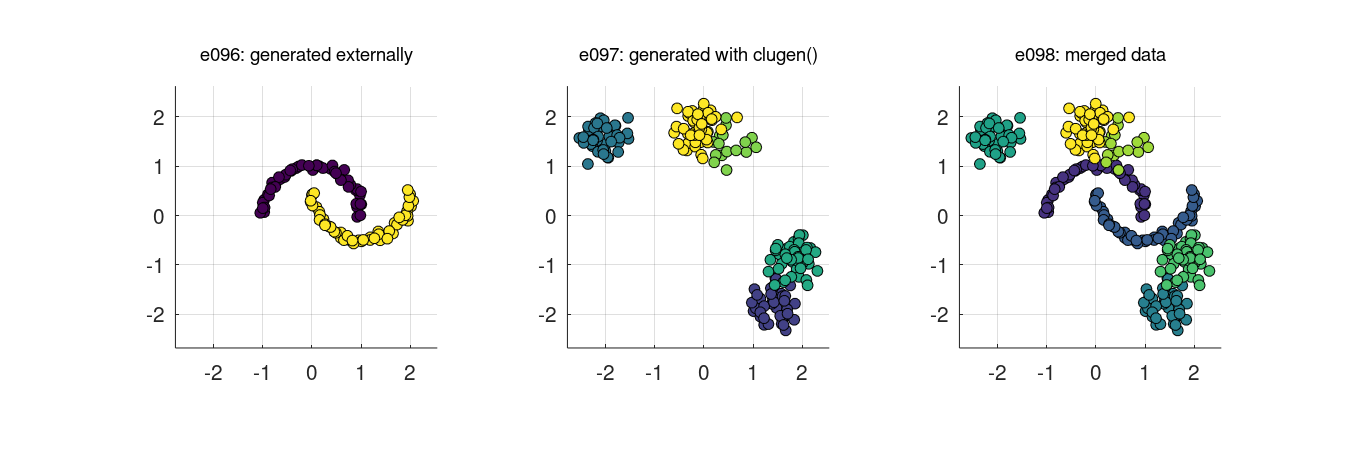
Merging with data not generated with clugen()
Data generated with clugen() can be merged with other data sets, for example
data created with one of scikit-learn's generators:
seed = 999;

% Load data generated externally with make_moons() function from scikit-learn
fid = fopen('docs/moons.csv');
moons = textscan(fid, '%d,%f,%f');
fclose(fid);

e096 = struct('points', [moons{2} moons{3}], 'clusters', moons{1});
e097 = clugen(2, 5, 200, [1 1], pi / 12, [1 1], 0.1, 0.01, 0.25, 'seed', seed, ...
    'proj_dist_fn', 'unif', 'point_dist_fn', 'n');
e098 = clumerge({e096, e097});
plot_examples_2d(...
    e096, 'e096: generated externally', ...
    e097, 'e097: generated with clugen()', ...
    e098, 'e098: merged data');
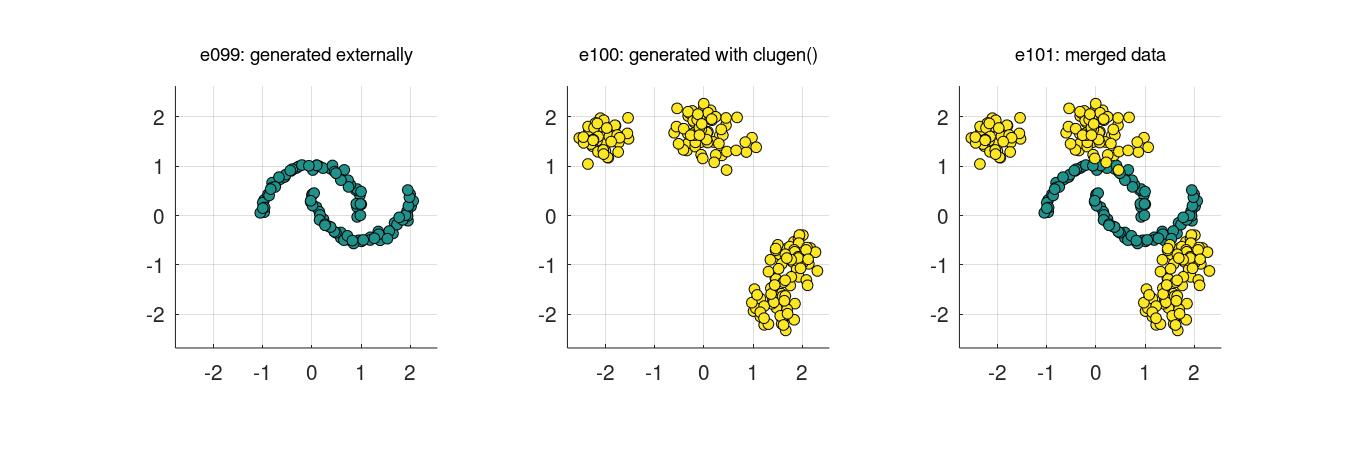
We can also hierarchize clusters from different sources:
e099 = struct('points', e096.points, 'clusters', ones(numel(e096.clusters), 1, 'int64'));
e100 = struct('points', e097.points, 'clusters', ones(numel(e097.clusters), 1, 'int64'));
e101 = clumerge({e099, e100});
plot_examples_2d(...
    e099, 'e099: generated externally', ...
    e100, 'e100: generated with clugen()', ...
    e101, 'e101: merged data');