Note
Click here to download the full example code
Examples in 2D
This section contains several examples on how to generate 2D data with
pyclugen. To run the examples we first need to import the
clugen() function:
To plot these examples we use the plot_examples_2d
function:
Manipulating the direction of cluster-supporting lines
Using the direction parameter
e001 = clugen(2, 4, 2000, [1, 0], 0, [10, 10], 10, 1.5, 0.5, rng=seed)
e002 = clugen(2, 4, 200, [1, 1], 0, [10, 10], 10, 1.5, 0.5, rng=seed)
e003 = clugen(2, 4, 200, [0, 1], 0, [10, 10], 10, 1.5, 0.5, rng=seed)
plot_examples_2d(
    e001, "e001: direction = [1, 0]",
    e002, "e002: direction = [1, 1]",
    e003, "e003: direction = [0, 1]")
![e001: direction = [1, 0], e002: direction = [1, 1], e003: direction = [0, 1]](../images/mkd_glr_plot_2_2d_examples_001.png)
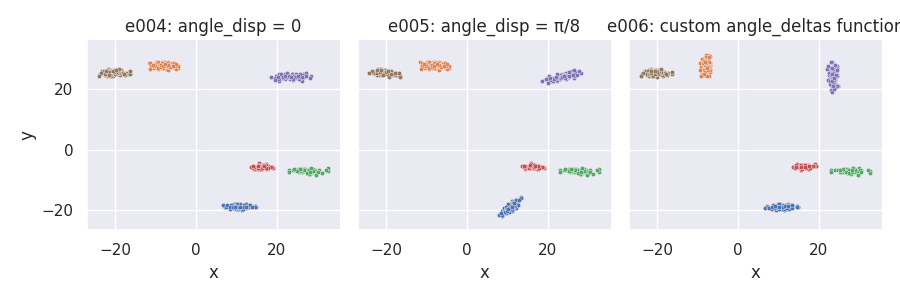
Changing the angle_disp parameter and using a custom angle_deltas_fn function
# Custom angle_deltas function: arbitrarily rotate some clusters by 90 degrees
def angdel_90_fn(nclu, astd, rng):
    return rng.choice([0, np.pi / 2], size=nclu)
e004 = clugen(2, 6, 500, [1, 0], 0, [10, 10], 10, 1.5, 0.5, rng=seed)
e005 = clugen(2, 6, 500, [1, 0], np.pi / 8, [10, 10], 10, 1.5, 0.5, rng=seed)
e006 = clugen(2, 6, 500, [1, 0], 0, [10, 10], 10, 1.5, 0.5, rng=seed,
    angle_deltas_fn=angdel_90_fn)
plot_examples_2d(
    e004, "e004: angle_disp = 0",
    e005, "e005: angle_disp = π/8",
    e006, "e006: custom angle_deltas function")
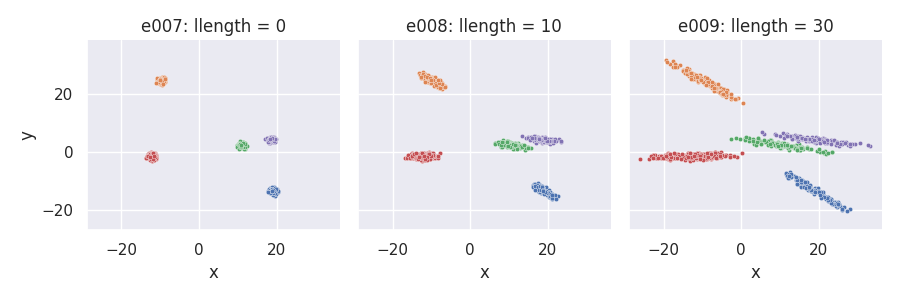
Manipulating the length of cluster-supporting lines
Using the llength parameter
e007 = clugen(2, 5, 800, [1, 0], np.pi / 10, [10, 10],  0, 0, 0.5, rng=seed,
    point_dist_fn="n")
e008 = clugen(2, 5, 800, [1, 0], np.pi / 10, [10, 10], 10, 0, 0.5, rng=seed,
    point_dist_fn="n")
e009 = clugen(2, 5, 800, [1, 0], np.pi / 10, [10, 10], 30, 0, 0.5, rng=seed,
    point_dist_fn="n")
plot_examples_2d(
    e007, "e007: llength = 0",
    e008, "e008: llength = 10",
    e009, "e009: llength = 30")
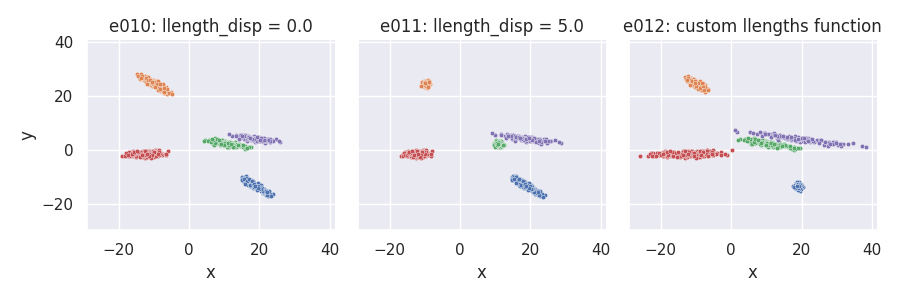
Changing the llength_disp parameter and using a custom llengths_fn function
# Custom llengths function: line lengths grow for each new cluster
def llen_grow_fn(nclu, llen, llenstd, rng):
    return llen * np.arange(nclu) + rng.normal(scale=llenstd, size=nclu)
e010 = clugen(2, 5, 800, [1, 0], np.pi / 10, [10, 10], 15,  0.0, 0.5, rng=seed,
    point_dist_fn="n")
e011 = clugen(2, 5, 800, [1, 0], np.pi / 10, [10, 10], 15, 10.0, 0.5, rng=seed,
    point_dist_fn="n")
e012 = clugen(2, 5, 800, [1, 0], np.pi / 10, [10, 10], 10,  0.1, 0.5, rng=seed,
    llengths_fn=llen_grow_fn, point_dist_fn="n")
plot_examples_2d(
    e010, "e010: llength_disp = 0.0",
    e011, "e011: llength_disp = 5.0",
    e012, "e012: custom llengths function")
Manipulating relative cluster positions
Using the cluster_sep parameter
e013 = clugen(2, 8, 1000, [1, 1], np.pi / 4, [10, 10], 10, 2, 2.5, rng=seed)
e014 = clugen(2, 8, 1000, [1, 1], np.pi / 4, [30, 10], 10, 2, 2.5, rng=seed)
e015 = clugen(2, 8, 1000, [1, 1], np.pi / 4, [10, 30], 10, 2, 2.5, rng=seed)
plt = plot_examples_2d(
    e013, "e013: cluster_sep = [10, 10]",
    e014, "e014: cluster_sep = [30, 10]",
    e015, "e015: cluster_sep = [10, 30]")
![e013: cluster_sep = [10, 10], e014: cluster_sep = [30, 10], e015: cluster_sep = [10, 30]](../images/mkd_glr_plot_2_2d_examples_005.png)
Changing the cluster_offset parameter and using a custom clucenters_fn function
# Custom clucenters function: places clusters in a diagonal
def centers_diag_fn(nclu, csep, coff, rng):
    return np.ones((nclu, len(csep))) * np.arange(1, nclu + 1)[:, None] * np.max(csep) + coff
e016 = clugen(2, 8, 1000, [1, 1], np.pi / 4, [10, 10], 10, 2, 2.5, rng=seed)
e017 = clugen(2, 8, 1000, [1, 1], np.pi / 4, [10, 10], 10, 2, 2.5, rng=seed,
    cluster_offset=[20, -20])
e018 = clugen(2, 8, 1000, [1, 1], np.pi / 4, [10, 10], 10, 2, 2.5, rng=seed,
    cluster_offset=[-50, -50], clucenters_fn=centers_diag_fn)
plt = plot_examples_2d(
    e016, "e016: default",
    e017, "e017: cluster_offset = [20, -20]",
    e018, "e018: custom clucenters function")
![e016: default, e017: cluster_offset = [20, -20], e018: custom clucenters function](../images/mkd_glr_plot_2_2d_examples_006.png)
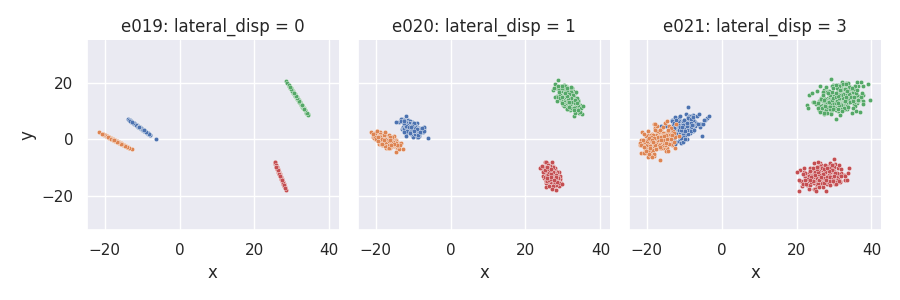
Lateral dispersion and placement of point projections on the line
Normal projection placement (default): proj_dist_fn = "norm"
e019 = clugen(2, 4, 1000, [1, 0], np.pi / 2, [20, 20], 13, 2, 0.0, rng=seed)
e020 = clugen(2, 4, 1000, [1, 0], np.pi / 2, [20, 20], 13, 2, 1.0, rng=seed)
e021 = clugen(2, 4, 1000, [1, 0], np.pi / 2, [20, 20], 13, 2, 3.0, rng=seed)
plt = plot_examples_2d(
    e019, "e019: lateral_disp = 0",
    e020, "e020: lateral_disp = 1",
    e021, "e021: lateral_disp = 3")
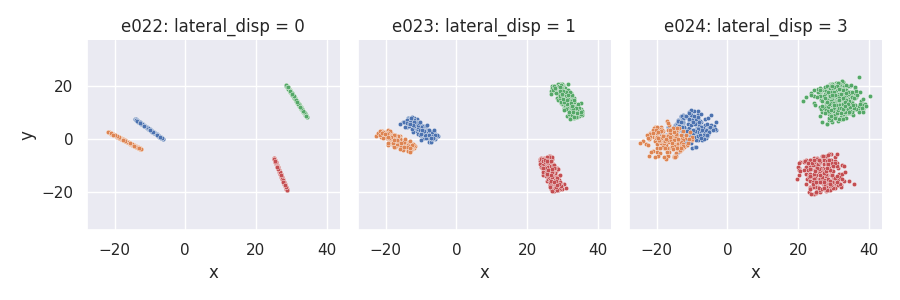
Uniform projection placement: proj_dist_fn = "unif"
e022 = clugen(2, 4, 1000, [1, 0], np.pi / 2, [20, 20], 13, 2, 0.0, rng=seed,
    proj_dist_fn="unif")
e023 = clugen(2, 4, 1000, [1, 0], np.pi / 2, [20, 20], 13, 2, 1.0, rng=seed,
    proj_dist_fn="unif")
e024 = clugen(2, 4, 1000, [1, 0], np.pi / 2, [20, 20], 13, 2, 3.0, rng=seed,
    proj_dist_fn="unif")
plt = plot_examples_2d(
    e022, "e022: lateral_disp = 0",
    e023, "e023: lateral_disp = 1",
    e024, "e024: lateral_disp = 3")
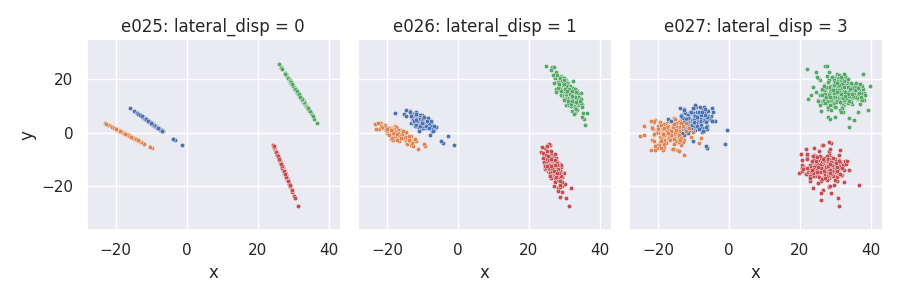
Custom projection placement using the Laplace distribution
# Custom proj_dist_fn: point projections placed using the Laplace distribution
def proj_laplace(len, n, rng):
    return rng.laplace(scale=len / 6, size=n)
e025 = clugen(2, 4, 1000, [1, 0], np.pi / 2, [20, 20], 13, 2, 0.0, rng=seed,
    proj_dist_fn=proj_laplace)
e026 = clugen(2, 4, 1000, [1, 0], np.pi / 2, [20, 20], 13, 2, 1.0, rng=seed,
    proj_dist_fn=proj_laplace)
e027 = clugen(2, 4, 1000, [1, 0], np.pi / 2, [20, 20], 13, 2, 3.0, rng=seed,
    proj_dist_fn=proj_laplace)
plt = plot_examples_2d(
    e025, "e025: lateral_disp = 0",
    e026, "e026: lateral_disp = 1",
    e027, "e027: lateral_disp = 3")
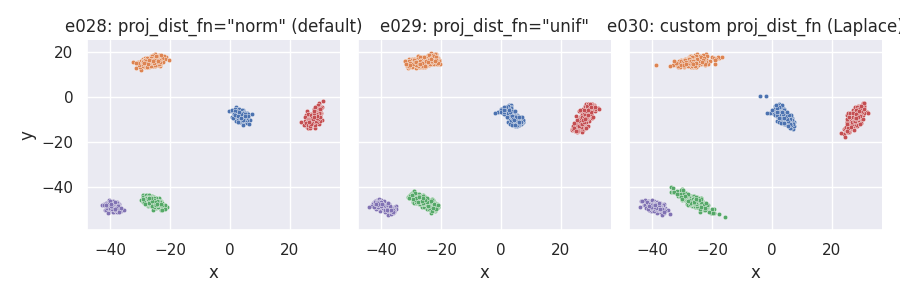
Controlling final point positions from their projections on the cluster-supporting line
Points on hyperplane orthogonal to cluster-supporting line (default): point_dist_fn = "n-1"
# Custom proj_dist_fn: point projections placed using the Laplace distribution
def proj_laplace(len, n, rng):
    return rng.laplace(scale=len / 6, size=n)
e028 = clugen(2, 5, 1500, [1, 0], np.pi / 3, [20, 20], 12, 3, 1.0, rng=seed)
e029 = clugen(2, 5, 1500, [1, 0], np.pi / 3, [20, 20], 12, 3, 1.0, rng=seed,
    proj_dist_fn="unif")
e030 = clugen(2, 5, 1500, [1, 0], np.pi / 3, [20, 20], 12, 3, 1.0, rng=seed,
    proj_dist_fn=proj_laplace)
plt = plot_examples_2d(
    e028, "e028: proj_dist_fn=\"norm\" (default)",
    e029, "e029: proj_dist_fn=\"unif\"",
    e030, "e030: custom proj_dist_fn (Laplace)")
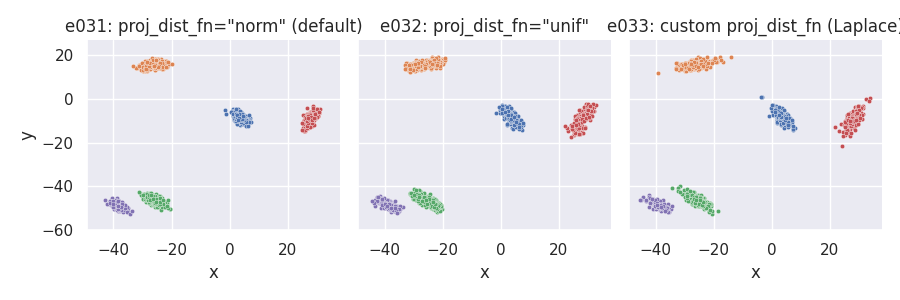
Points around projection on cluster-supporting line: point_dist_fn = "n"
# Custom proj_dist_fn: point projections placed using the Laplace distribution
def proj_laplace(len, n, rng):
    return rng.laplace(scale=len / 6, size=n)
e031 = clugen(2, 5, 1500, [1, 0], np.pi / 3, [20, 20], 12, 3, 1.0, rng=seed,
    point_dist_fn="n")
e032 = clugen(2, 5, 1500, [1, 0], np.pi / 3, [20, 20], 12, 3, 1.0, rng=seed,
    point_dist_fn="n", proj_dist_fn="unif")
e033 = clugen(2, 5, 1500, [1, 0], np.pi / 3, [20, 20], 12, 3, 1.0, rng=seed,
    point_dist_fn="n", proj_dist_fn=proj_laplace)
plt = plot_examples_2d(
    e031, "e031: proj_dist_fn=\"norm\" (default)",
    e032, "e032: proj_dist_fn=\"unif\"",
    e033, "e033: custom proj_dist_fn (Laplace)")
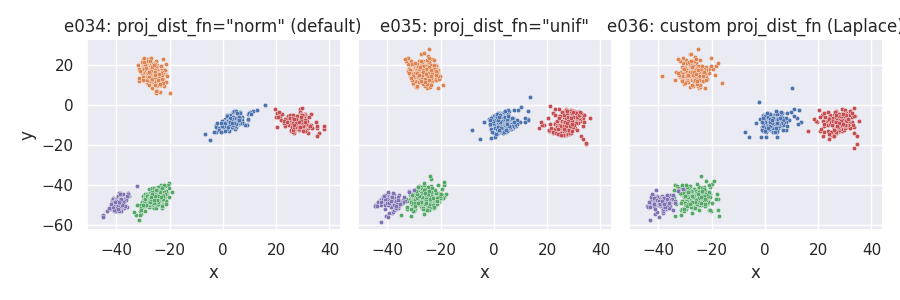
Custom point placement using the exponential distribution
For this example we require the
clupoints_n_1_template()
helper function:
# Custom point_dist_fn: final points placed using the Exponential distribution
def clupoints_n_1_exp(projs, lat_std, len, clu_dir, clu_ctr, rng):
    def dist_exp(npts, lstd, rg):
        return lstd * rg.exponential(scale=2 / lstd, size=npts)
    return clupoints_n_1_template(projs, lat_std, clu_dir, dist_exp, rng=rng)
# Custom proj_dist_fn: point projections placed using the Laplace distribution
def proj_laplace(len, n, rng):
    return rng.laplace(scale=len / 6, size=n)
e034 = clugen(2, 5, 1500, [1, 0], np.pi / 3, [20, 20], 12, 3, 1.0, rng=seed,
    point_dist_fn=clupoints_n_1_exp)
e035 = clugen(2, 5, 1500, [1, 0], np.pi / 3, [20, 20], 12, 3, 1.0, rng=seed,
    point_dist_fn=clupoints_n_1_exp, proj_dist_fn="unif")
e036 = clugen(2, 5, 1500, [1, 0], np.pi / 3, [20, 20], 12, 3, 1.0, rng=seed,
    point_dist_fn=clupoints_n_1_exp, proj_dist_fn=proj_laplace)
plt = plot_examples_2d(
    e034, "e034: proj_dist_fn=\"norm\" (default)",
    e035, "e035: proj_dist_fn=\"unif\"",
    e036, "e036: custom proj_dist_fn (Laplace)")
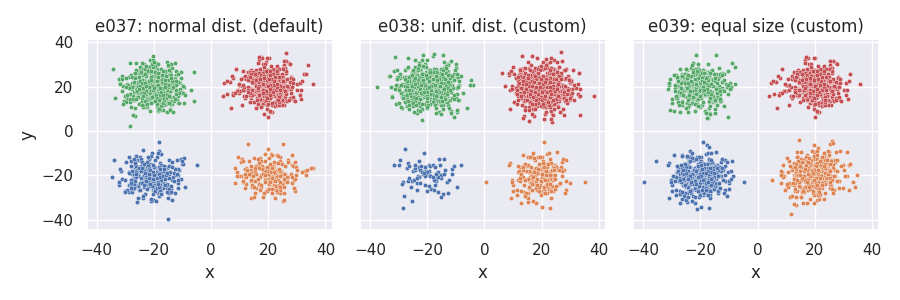
Manipulating cluster sizes
# Custom clusizes_fn (e038): cluster sizes determined via the uniform distribution,
# no correction for total points
def clusizes_unif(nclu, npts, ae, rng):
    return rng.integers(low=1, high=2 * npts / nclu + 1, size=nclu)
# Custom clusizes_fn (e039): clusters all have the same size, no correction for total points
def clusizes_equal(nclu, npts, ae, rng):
    return (npts // nclu) * np.ones(nclu, dtype=int)
# Custom clucenters_fn (all): yields fixed positions for the clusters
def centers_fixed(nclu, csep, coff, rng):
    return np.array([[-csep[0], -csep[1]], [csep[0], -csep[1]], [-csep[0], csep[1]], [csep[0], csep[1]]])
e037 = clugen(2, 4, 1500, [1, 1], np.pi, [20, 20], 0, 0, 5, rng=seed,
    point_dist_fn="n", clucenters_fn=centers_fixed)
e038 = clugen(2, 4, 1500, [1, 1], np.pi, [20, 20], 0, 0, 5, rng=seed,
    point_dist_fn="n", clucenters_fn=centers_fixed, clusizes_fn=clusizes_unif)
e039 = clugen(2, 4, 1500, [1, 1], np.pi, [20, 20], 0, 0, 5, rng=seed,
    point_dist_fn="n", clucenters_fn=centers_fixed, clusizes_fn=clusizes_equal)
plt = plot_examples_2d(
    e037, "e037: normal dist. (default)",
    e038, "e038: unif. dist. (custom)",
    e039, "e039: equal size (custom)")
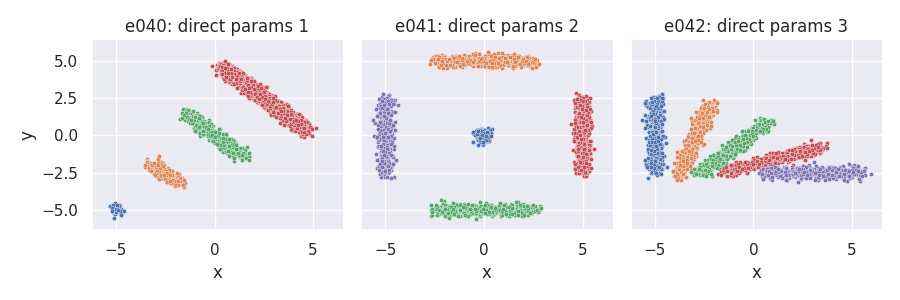
Direct specification of optional parameters
e040 = clugen(2, 4, 1000, [-1, 1], 0, [0, 0], 0, 0, 0.2, rng=seed,
    proj_dist_fn="unif", point_dist_fn="n", clusizes_fn=[50, 200, 500, 2000],
    llengths_fn=[0, 2, 4, 6], clucenters_fn=[[-5, -5], [-2.5, -2.5], [0, 0], [2.5, 2.5]])

e041 = clugen(2, 5, 1000, [[1, 1], [1, 0], [1, 0], [0, 1], [0, 1]],
    0, [0, 0], 0, 0, 0.2, rng=seed,
    proj_dist_fn="unif", point_dist_fn="n",
    clusizes_fn=[200, 500, 500, 500, 500], llengths_fn=[0, 5, 5, 5, 5],
    clucenters_fn=[[0, 0], [0, 5], [0, -5], [5, 0], [-5, 0]])

e042 = clugen(2, 5, 1000, [[0, 1], [0.25, 0.75], [0.5, 0.5], [0.75, 0.25], [1, 0]],
    0, [0, 0], 5, 0, 0.2, rng=seed,
    proj_dist_fn="unif", point_dist_fn="n", clusizes_fn=[500, 500, 500, 500, 500],
    clucenters_fn=[[-5, 0], [-3, -0.3], [-1, -0.8], [1, -1.6], [3, -2.5]])
plt = plot_examples_2d(
    e040, "e040: direct params 1",
    e041, "e041: direct params 2",
    e042, "e042: direct params 3")
Total running time of the script: ( 0 minutes 8.236 seconds)
Download Python source code: plot_2_2d_examples.py