Note
Click here to download the full example code
Examples in 1D
This section contains several examples on how to generate 1D data with
pyclugen. To run the examples we first need to import the
clugen() function:
To plot these examples we use the plot_examples_1d
function:
Basic 1D example with density plot
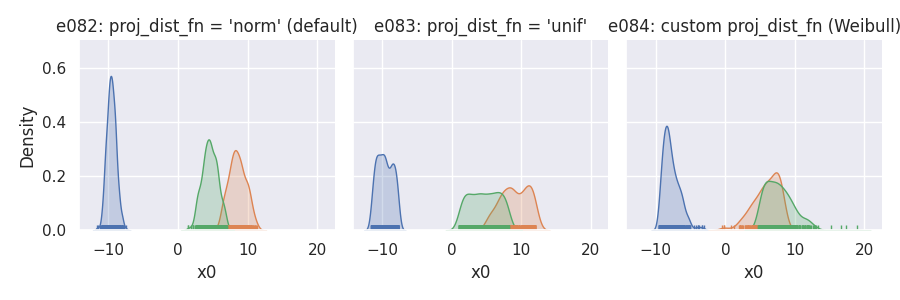
# Custom proj_dist_fn: point projections placed using the Weibull distribution
def proj_weibull(len, n, rng):
    return len / 2 * rng.weibull(1.5, size=n)
e082 = clugen(1, 3, 1000, [1], 0, [10], 6, 1.5, 0, rng=seed)
e083 = clugen(1, 3, 1000, [1], 0, [10], 6, 1.5, 0, rng=seed, proj_dist_fn="unif")
e084 = clugen(1, 3, 1000, [1], 0, [10], 6, 1.5, 0, rng=seed, proj_dist_fn=proj_weibull)
plot_examples_1d(
    e082, "e082: proj_dist_fn = 'norm' (default)",
    e083, "e083: proj_dist_fn = 'unif'",
    e084, "e084: custom proj_dist_fn (Weibull)")
Total running time of the script: ( 0 minutes 1.310 seconds)
Download Python source code: plot_1_1d_examples.py