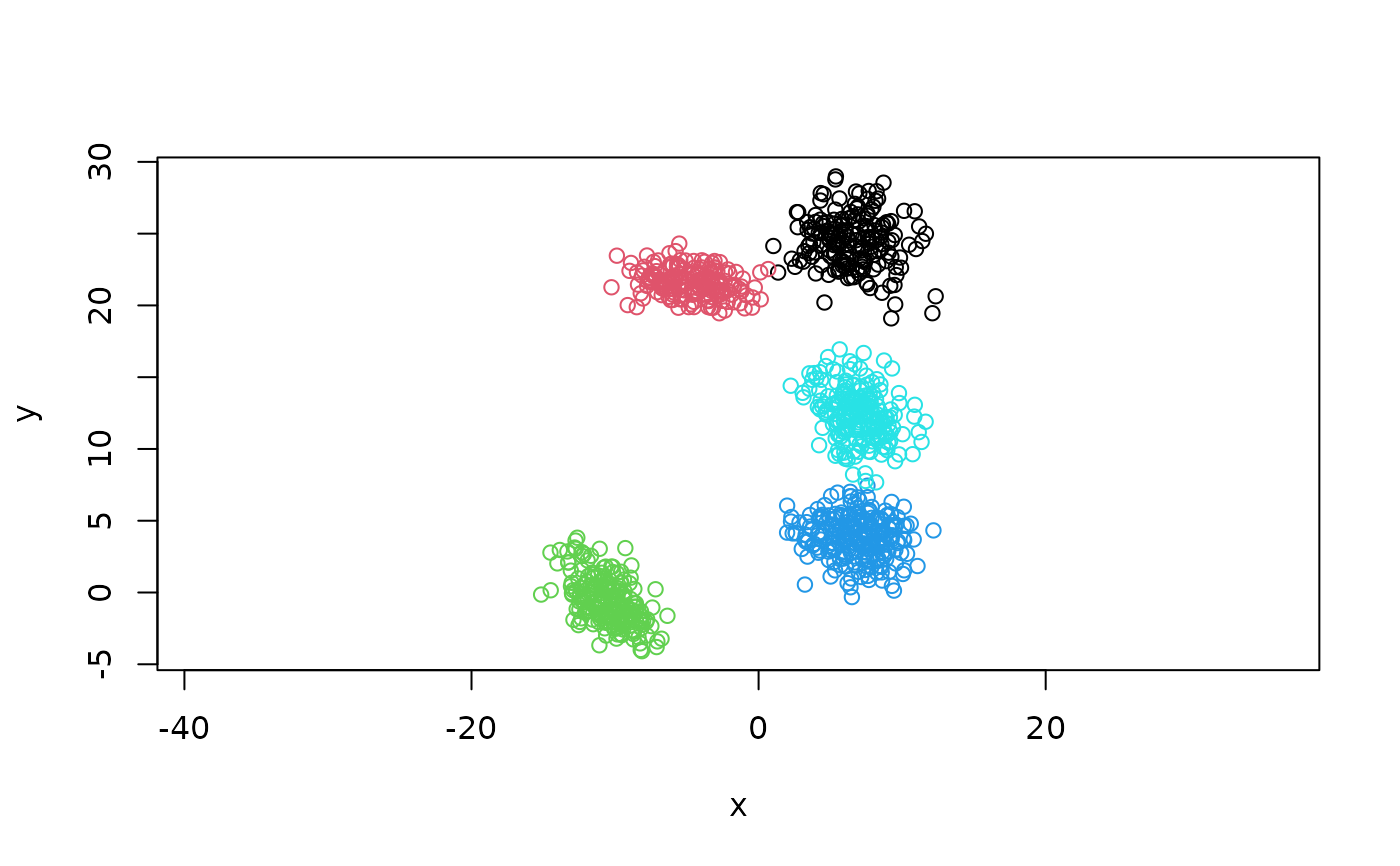
This is the main function of clugenr, and possibly the only function most users will need.
Usage
clugen(
  num_dims,
  num_clusters,
  num_points,
  direction,
  angle_disp,
  cluster_sep,
  llength,
  llength_disp,
  lateral_disp,
  allow_empty = FALSE,
  cluster_offset = NA,
  proj_dist_fn = "norm",
  point_dist_fn = "n-1",
  clusizes_fn = clusizes,
  clucenters_fn = clucenters,
  llengths_fn = llengths,
  angle_deltas_fn = angle_deltas,
  seed = NA
)
Arguments
- num_dims
Number of dimensions.
- num_clusters
Number of clusters to generate.
- num_points
Total number of points to generate.
- direction
Average direction of the cluster-supporting lines. Can be a vector of length
num_dims(same direction for all clusters) or a matrix of sizenum_clustersxnum_dims(one direction per cluster).- angle_disp
Angle dispersion of cluster-supporting lines (radians).
- cluster_sep
Average cluster separation in each dimension (vector of length
num_dims).- llength
Average length of cluster-supporting lines.
- llength_disp
Length dispersion of cluster-supporting lines.
- lateral_disp
Cluster lateral dispersion, i.e., dispersion of points from their projection on the cluster-supporting line.
- allow_empty
Allow empty clusters?
FALSEby default.- cluster_offset
Offset to add to all cluster centers (vector of length
num_dims). By default there will be no offset.- proj_dist_fn
Distribution of point projections along cluster-supporting lines, with three possible values:
"norm"(default): Distribute point projections along lines using a normal distribution (\(\mu=\) line_center, \(\sigma=\)llength/6)."unif": Distribute points uniformly along the line.User-defined function, which accepts two parameters, line length (
double) and number of points (integer), and returns a vector containing the distance of each point projection to the center of the line. For example, the"norm"option roughly corresponds tofunction(l, n) stats::rnorm(n, sd = l / 6).
- point_dist_fn
Controls how the final points are created from their projections on the cluster-supporting lines, with three possible values:
"n-1"(default): Final points are placed on a hyperplane orthogonal to the cluster-supporting line, centered at each point's projection, using the normal distribution (\(\mu=0\), \(\sigma=\)lateral_disp). This is done by the clupoints_n_1 function."n": Final points are placed around their projection on the cluster-supporting line using the normal distribution (\(\mu=0\), \(\sigma=\)lateral_disp). This is done by the clupoints_n function.User-defined function: The user can specify a custom point placement strategy by passing a function with the same signature as clupoints_n_1 and clupoints_n.
- clusizes_fn
Distribution of cluster sizes. By default, cluster sizes are determined by the clusizes function, which uses the normal distribution (\(\mu=\)
num_points/num_clusters, \(\sigma=\mu/3\)), and assures that the final cluster sizes add up tonum_points. This parameter allows the user to specify a custom function for this purpose, which must follow clusizes signature. Note that custom functions are not required to strictly obey thenum_pointsparameter. Alternatively, the user can specify a vector of cluster sizes directly.- clucenters_fn
Distribution of cluster centers. By default, cluster centers are determined by the clucenters function, which uses the uniform distribution, and takes into account the
num_clustersandcluster_sepparameters for generating well-distributed cluster centers. This parameter allows the user to specify a custom function for this purpose, which must follow clucenters signature. Alternatively, the user can specify a matrix of sizenum_clustersxnum_dimswith the exact cluster centers.- llengths_fn
Distribution of line lengths. By default, the lengths of cluster-supporting lines are determined by the llengths function, which uses the folded normal distribution (\(\mu=\)
llength, \(\sigma=\)llength_disp). This parameter allows the user to specify a custom function for this purpose, which must follow llengths signature. Alternatively, the user can specify a vector of line lengths directly.- angle_deltas_fn
Distribution of line angle differences with respect to
direction. By default, the angles between the maindirectionof each cluster and the final directions of their cluster-supporting lines are determined by the angle_deltas function, which uses the wrapped normal distribution (\(\mu=0\), \(\sigma=\)angle_disp) with support in the interval \(\left[-\pi/2,\pi/2\right]\). This parameter allows the user to specify a custom function for this purpose, which must follow angle_deltas signature. Alternatively, the user can specify a vector of angle deltas directly.- seed
An integer used to initialize the PRNG, allowing for reproducible results. If specified,
seedis simply passed to set.seed.
Value
A named list with the following elements:
points: Anum_pointsxnum_dimsmatrix with the generated points for all clusters.clusters: Anum_pointsfactor vector indicating which cluster each point inpointsbelongs to.projections: Anum_pointsxnum_dimsmatrix with the point projections on the cluster-supporting lines.sizes: Anum_clustersx 1 vector with the number of points in each cluster.centers: Anum_clustersxnum_dimsmatrix with the coordinates of the cluster centers.directions: Anum_clustersxnum_dimsmatrix with the final direction of each cluster-supporting line.angles: Anum_clustersx 1 vector with the angles between the cluster-supporting lines and the main direction.lengths: Anum_clustersx 1 vector with the lengths of the cluster-supporting lines.
Details
If a custom function was given in the clusizes_fn parameter, it is
possible that num_points may have a different value than what was
specified in the num_points parameter.
The terms "average" and "dispersion" refer to measures of central tendency and statistical dispersion, respectively. Their exact meaning depends on the optional arguments.
Note
This function is stochastic. For reproducibility set a PRNG seed with set.seed.

